When SaaS Founders Should Stop Building Features and Start Fixing Conversion
Stop chasing features—optimize onboarding, pricing, and funnels to boost trial-to-paid conversions and retention.
Building more features won’t solve your growth problems. If your SaaS revenue is stalling despite constant feature releases, it’s time to shift focus. Here’s why:
- 80% of features go unused, wasting billions annually.
- 6.4% of features drive 80% of engagement. Most users rely on a small fraction of your product.
- Adding features without addressing low conversions or poor onboarding only creates more complexity and costs.
Instead, focus on key metrics like trial-to-paid conversions, activation rates, and retention. Simplify onboarding, improve user flows, and optimize pricing strategies. These steps often deliver better results than new features ever could.
Key takeaway: Stop chasing features. Fix your funnel, and watch your revenue grow.
How to Increase Your SaaS Trial Conversions Without Developer Involvement | Audrey Melnik
::: @iframe https://www.youtube.com/embed/9GKFQwdvu7w :::
Finding Conversion Bottlenecks in Your SaaS Funnel
::: @figure 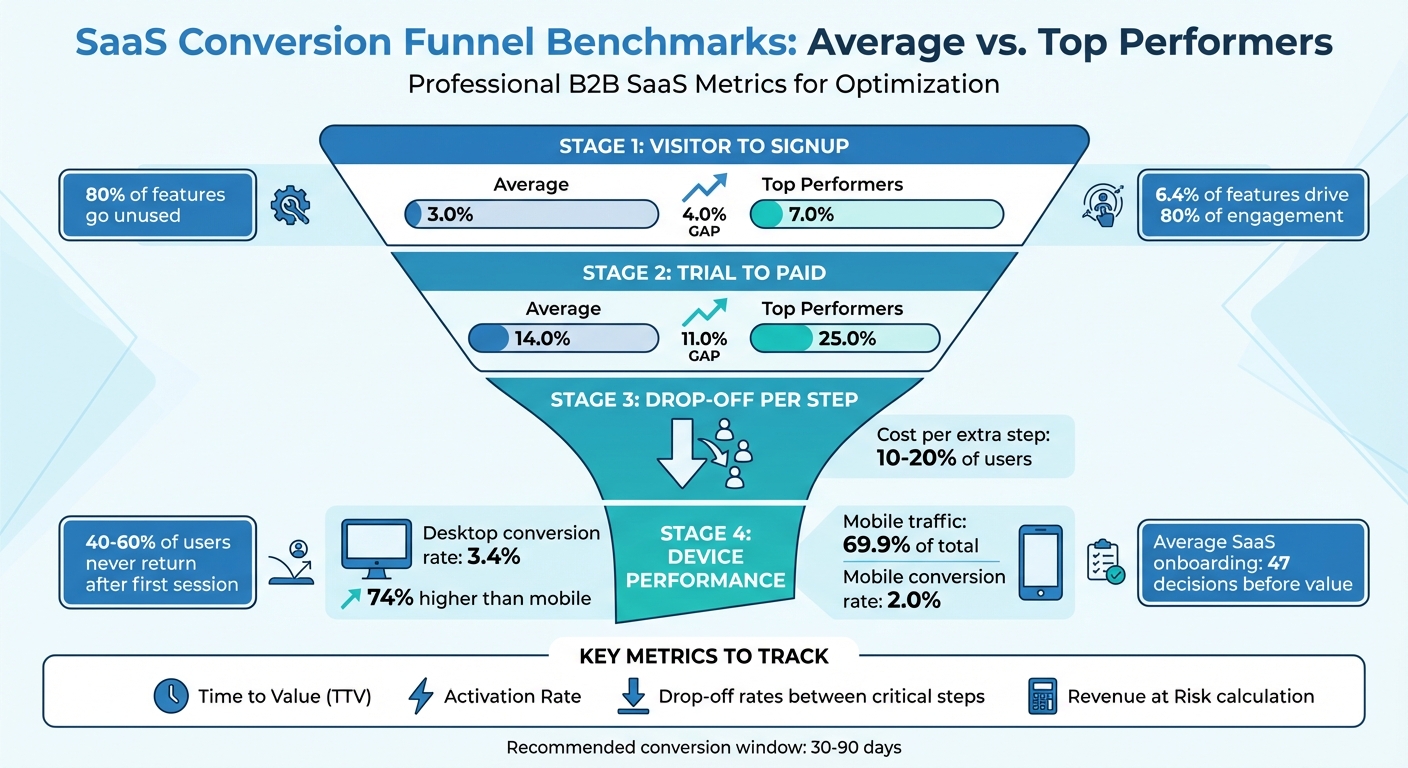 :::
:::
Key Metrics to Track in Your Funnel
When it comes to boosting revenue in SaaS, the real game-changer often lies beyond your landing page - it’s what happens after someone signs up [2]. To figure out where users are slipping through the cracks, start by keeping an eye on crucial metrics. For instance, the average visitor-to-signup conversion rate for SaaS companies is about 3.0%, while top performers hit closer to 7.0% [2]. Similarly, trial-to-paid conversion rates typically hover around 14.0%, but the best in the business manage rates of 25.0% or higher [2].
Pay special attention to activation - the point where users experience real value for the first time. This could be something like completing their first report within a week. To measure this effectively, track Time to Value (TTV). A shorter TTV often translates into better retention and higher conversions [3].
Also, look at the drop-off rates between critical steps, such as connecting a data source or inviting a team. Every extra step can cost you 10–20% of users [2]. As digital marketer Abhaya wisely notes:
"If a metric doesn't inform a decision, it's not worth tracking" [3].
By focusing on these metrics, you’ll be better equipped to map out your funnel and identify where users are falling off.
How to Map and Visualize Drop-Off Points
To pinpoint where users are dropping off, create a map of your funnel with 4–8 steps. Depending on your product, you might use a closed funnel for straightforward user journeys or an open funnel for more exploratory processes. A typical SaaS funnel might look like this: Visit → Signup → Activation → Paid Conversion. Aim for a conversion window of 30–90 days to capture meaningful data.
To figure out the financial impact of these drop-offs, calculate your Revenue at Risk. Multiply the number of visitors at each stage by the drop-off rate and the average order value. This will help you zero in on the most expensive bottlenecks. Pair this quantitative analysis with tools like Hotjar or Clarity to watch session recordings and see exactly what’s tripping users up. As Randy Wattilete, founder of Kirro, puts it:
"If you only track one CRO number, your overall conversion rate is fine. But it's like checking your car's 'check engine' light. It tells you something's wrong. It doesn't tell you what. Funnel analysis opens the hood" [5].
While mapping your funnel reveals general bottlenecks, breaking your data into segments can show which user groups are struggling the most.
Segment Your Users for Better Insights
Once you’ve identified where users are dropping off, dig deeper by segmenting your audience. Aggregated data can mask critical issues, so it’s essential to analyze groups separately. For example, mobile accounts for 69.9% of traffic, but desktop users have a 74% higher conversion rate (3.4% vs. 2.0%) [5]. Segment your funnel by acquisition channel - users from paid search may behave differently than those from content marketing or partnerships [4].
You can also break your data down by factors like company size, job title, or account type (e.g., team accounts versus solo users). This can help you determine if specific groups are facing unique challenges [4]. Additionally, compare new users to returning ones and analyze signup cohorts over time. If you notice a sudden drop in conversions after a product update, you might have uncovered a key friction point [4].
Before diving into optimizations, make sure your tracking is accurate. Double-check that events are firing correctly and that identity stitching is working as intended to avoid basing decisions on faulty data [4]. As Roman Mohren, CEO of FullSession, advises:
"If slow/error sessions are the ones leaking, fix reliability before polishing UX copy" [4].
To make meaningful progress, focus on fixing bottlenecks that directly impact your primary KPI and are backed by reliable data. This approach will help you drive real improvements in activation rates.
How to Improve Conversion: Practical Steps
Simplify Onboarding to Reduce Friction
Making the onboarding process smoother can greatly improve conversion rates. Why? Because onboarding plays a huge role in user retention - studies show that 40% to 60% of users never come back after their first session [7]. On average, SaaS platforms make users go through 47 decisions before they even get to experience value [9]. That’s a lot of friction.
To fix this, break your onboarding into specific steps tied to activation milestones, like creating an account, connecting data, or using a feature for the first time. Track completion rates for each step. If one step has a 60% completion rate while others are at 95%, you've identified a problem [6]. Also, measure how long each step takes. Quick tasks should take under 30 seconds, and more complex ones should stay under 5 minutes [6][7].
Cut out unnecessary steps before users see value. Things like team invites, advanced settings, or profile customization can wait until after users experience the product's core benefits [8][9]. Even minor changes, like reducing form fields from four to three, can increase conversions by 50% [8]. Plus, users who reach activation on day one are three times more likely to stick around [7].
Use progressive disclosure - show advanced features only when they’re relevant to what the user is doing [7][9]. For example, during signup, ask, “What brings you here today?” and tailor the experience based on their goals [9]. Set real-time alerts for users who take longer than usual to complete a step, and offer help through tooltips or live chat [7].
Once you’ve made these changes, validate them through A/B testing to ensure they’re effective.
Run A/B Tests for Continuous Improvement
A/B testing is essential for refining your strategy before rolling out changes widely. Focus on high-impact areas like your homepage, pricing page, and signup flow, which account for 80% of conversions [11]. For context, the average SaaS landing page converts at 3.8%, but the best ones hit 11.6% or more [10].
Start with a clear hypothesis: “Based on [data/insight], we believe that [change] will lead to [impact]” [11][12]. Use frameworks like ICE (Impact, Confidence, Ease) to prioritize high-value experiments [10][11]. If you’re in a B2B space with lower traffic, focus on testing larger changes, like a new value proposition or pricing model, rather than small tweaks like button colors [12].
Watch at least 50 session recordings to spot where users hesitate. Then, simplify your copy to a 5th–7th grade reading level - content at this level has a 12.9% conversion rate, compared to just 2.1% for professional-level language [10]. Keep signup forms short, with only 3–5 fields, and use progressive profiling to gather more data later [10][11].
Run each test for at least 14 days to account for weekly patterns [11][12]. Wait until you hit 95% statistical significance before calling a winner [11][12]. Keep in mind that most B2B A/B tests (7 out of 8) don’t yield significant results [12]. However, tests focused on CTAs and value propositions succeed more often, with a 35% to 40% success rate. Pricing page tests have a lower success rate (15%) but can lead to major revenue gains when they work [2].
Once you’ve identified successful changes, shift your focus to optimizing pricing strategies.
Test and Optimize Your Pricing
Your pricing page is a key driver of revenue, so experimenting with it can yield big results. Test different pricing models - like per-seat, usage-based, or flat-rate structures - to align with how customers perceive value [13]. Try adjusting price points by 10–20% up or down to see how it affects signups and long-term revenue [13].
Reevaluate your tiered pricing. Test “Good-Better-Best” packages and move high-value features between tiers to guide users toward specific plans [13]. Adding labels like “Most Popular” or “Recommended” can also help simplify decision-making [13]. Address common concerns directly on the pricing page with an FAQ section covering things like cancellation policies and payment methods [13].
Instead of sending upgrade prompts on a calendar schedule, trigger them when users hit feature limits. For example, notify them with a message like, “You’ve hit your 10-project limit” [2]. Also, compare the impact of annual versus monthly billing by emphasizing savings, such as “Save 20%” or “2 Months Free” [13]. Finally, test whether a freemium model or a time-limited free trial works better for acquiring and retaining customers [13].
Build Retention Systems to Sustain Growth
Use Lifecycle Emails and In-App Messages
Boosting conversions is only half the battle - retaining those customers is what transforms short-term wins into long-term success. Retention doesn’t just protect your gains; it amplifies them. For instance, reducing monthly churn from 8% to 3% can increase customer lifetime value by a staggering 166% [15]. That’s why lifecycle communication is so important - it keeps users engaged and loyal well after they’ve signed up.
Lifecycle emails stand out because they’re triggered by user behavior, not a fixed schedule. For example, you might send an email when a user’s weekly activity drops below 50% of their 30-day average [15][17]. This targeted approach can increase engagement by up to 60% [17]. As Ronald Davenport, a Lifecycle Marketing Consultant, puts it:
"A lifecycle email has one job: move a user closer to the next meaningful action. If it doesn't do that, it doesn't matter how good your subject line is." [16]
Here’s a real-world example: In early 2023, the founder of Gatilab swapped out generic “we miss you” emails for behavior-specific nudges triggered by a 50% drop in usage. The result? They recovered 23% of at-risk users and slashed monthly churn from 8.2% to 3.1% in just three months [15].
To maximize retention, focus your messages on key moments like activation, habit formation, expansion, and advocacy [17]. Monthly value reports that highlight benefits - like time saved or tasks completed - can make your product’s value crystal clear before renewal time. Celebrating user milestones with quick, non-sales messages (e.g., “You just sent your 10,000th email!”) also reinforces positive engagement [18].
Don’t overlook involuntary churn - payment failures can account for 10% to 40% of lost customers. Automating dunning management can make a huge difference. For example, send pre-expiry warnings (like 14 days before a card expires) and follow up after failed payments. Include a direct link to update payment details and offer a 7-day grace period. This simple strategy can raise recovery rates from 22% to 58% [15].
Track and Improve Retention Over Time
While lifecycle communications are key to keeping users engaged, tracking retention metrics is essential for long-term success. You can’t fix what you don’t measure. Start by distinguishing between voluntary and involuntary churn [20]. Use cohort analysis based on signup dates to see if improvements to your product or onboarding process are leading to better long-term loyalty [19][20]. Keep an eye on metrics like activation rate (how many users complete the core value event), time to first value, and adoption of key features.
A customer health score can help you spot potential churn early. Build this score using factors like recency of core actions (30%), weekly activity compared to the cohort median (25%), and the number of active collaborators (20%) [14]. Declines in login frequency or reduced use of key features are early warning signs of passive churn [14][20].
For SaaS companies, a healthy retention rate typically ranges between 72% and 88% [19]. If your numbers fall below this range, focus on speeding up the time it takes for users to reach their “aha moment.” Early success is a strong predictor of long-term retention [20]. Even a small 5% improvement in retention can lead to a profit increase of 25% to 95% [19].
Conclusion: Balance Features and Conversion for Long-Term Growth
Key Takeaways for SaaS Founders
If you're aiming for sustainable growth in the SaaS world, the focus should shift from constantly building new features to identifying and addressing the constraints that limit revenue growth. As Housipro aptly puts it:
"The irony of SaaS prioritization is that companies often need to build fewer new things in order to grow faster." [1]
This means asking, "What’s holding back our revenue engine the most right now?" instead of "What should we build next?" [1].
Pay attention to the metrics that matter. For example, boosting user activation by just 25% could lead to a 34% revenue increase [10]. And while the median SaaS landing page converts at 3.8%, the best ones hit 11.6% or more [10]. That gap is a massive opportunity to grow your revenue.
Sometimes, the most impactful changes are the simplest. For instance:
- Writing copy at a 5th–7th grade reading level can yield a 12.9% conversion rate, compared to just 2.1% for more complex, professional-level text [10].
- Reducing form fields from 11 to 4 has been shown to boost conversions by 120% [10].
These kinds of improvements don’t require engineering resources but can deliver impressive results.
Next Steps for Sustained Growth
The first step is figuring out your main revenue bottleneck. Is it trial conversion, user activation, or retention? Once you’ve identified the weak link, shift resources toward experiments. High-growth SaaS companies often set up dedicated growth teams to test and refine strategies rather than focusing solely on new features [1].
Stick to a disciplined testing routine. Aim for 5–6 pricing and onboarding experiments annually. Three quarterly tests that each improve results by 12–18% can lead to a 52% overall gain [10]. Keep an eye on key metrics like activation rates, time to first value, and cohort retention on a weekly basis.
Think of your product roadmap as an extension of your business model. Every initiative should tie directly to growth levers like ARPU, retention, or conversion [1]. In the end, the SaaS companies that thrive aren’t the ones with the most features - they’re the ones that consistently optimize the journey from visitor to paying customer to loyal advocate.
FAQs
::: faq
How do I know if I should pause feature work and focus on conversion?
You should hit the brakes on adding new features and shift your focus to conversion when user acquisition or retention isn't improving. Key red flags include feature bloat - where too many features overwhelm or confuse users - or if conversion rates stay flat even after rolling out new updates. If your data points to issues like clunky onboarding processes or underperforming landing pages, tackling those bottlenecks can often lead to more impactful growth than simply piling on additional features. :::
::: faq
What’s the best way to find the biggest drop-off in my funnel fast?
To pinpoint where users are dropping off in your funnel, use funnel analysis tools that provide a clear visualization of user progression. These tools make it easy to see the stages where users exit, so you can focus on addressing the most critical areas. By tracking user actions step-by-step and spotting bottlenecks, you can prioritize updates that will make the biggest difference in boosting your conversion rates. :::
::: faq
What onboarding change typically boosts trial-to-paid the most?
Streamlining the first-time user experience is key to helping users quickly discover their “aha moment” - that instant when they truly grasp the value of your product. To improve trial-to-paid conversions, focus on cutting out unnecessary steps, making the process smoother, and guiding users straight to your product's core benefits during onboarding. :::
Go deeper than any blog post.
The full system behind these articles—frameworks, diagnostics, and playbooks delivered to your inbox.
No spam. Unsubscribe anytime.