SaaS Conversion Rate Benchmarks 2026: Data from 1,200+ Companies
SaaS conversion rates are declining—benchmarks and tactics to improve trial-to-paid, PQLs, funnels and channel performance.
SaaS Conversion Rate Benchmarks 2026: Data from 1,200+ Companies
SaaS companies in 2026 face declining conversion rates and tougher competition, but understanding benchmarks can help you stay ahead. Here's what you need to know:
- Trial Conversion Trends: Median free-to-paid conversion rates dropped to 34% by 2025 (from 50% in 2023). Opt-out trials (credit card required) convert at 48.8%, while opt-in trials average 18.2%.
- Funnel Benchmarks: Visitor-to-lead rates for B2B SaaS average 1.5–2.5%. MQL-to-SQL conversion rates are 32–40%, while SQL-to-close rates range from 20–25%.
- Top Performers: Elite SaaS companies achieve visitor-to-lead conversion rates of 8–15% and trial-to-paid rates of 50–60% (credit card required).
- Industry Insights: CRM tools excel with trial-to-paid rates near 31.4%, while EdTech struggles with freemium-to-paid rates of 2.6%.
- Marketing Channels: SEO leads with a 2.1% visitor-to-lead rate, outperforming PPC (0.7%). LinkedIn delivers strong ROI and SQL-to-close rates of 39%.
Quick Takeaway:
To improve conversions, focus on trial design, track Product-Qualified Leads (PQLs), and optimize onboarding for faster activation. AI personalization and pricing transparency are also key drivers of success in 2026.
How to Improve your Conversion Rate [+ Top 4 B2B SaaS Benchmarks]
::: @iframe https://www.youtube.com/embed/Jjx5HivZleg :::
2026 SaaS Funnel Conversion Rates: The Numbers
::: @figure 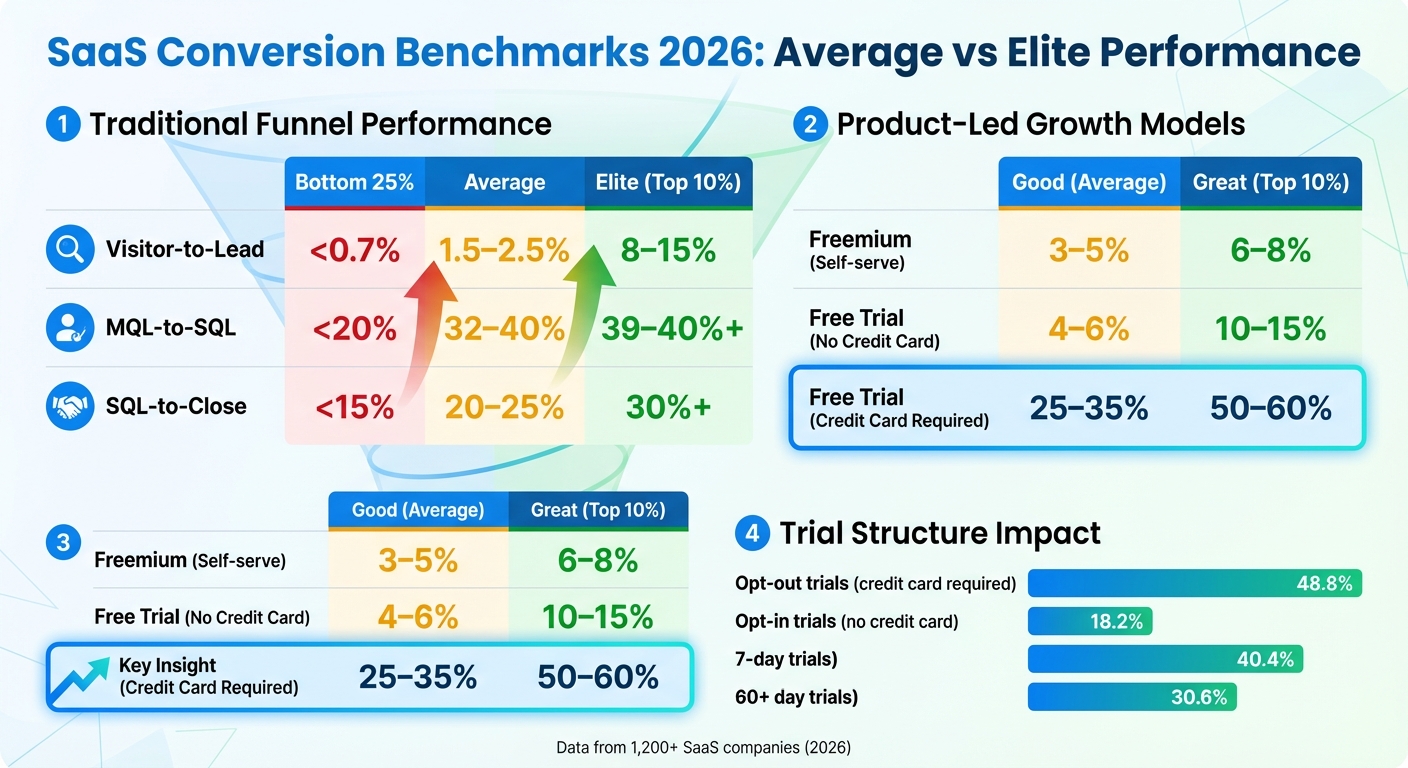 :::
:::
Conversion Rates by Funnel Stage
The SaaS funnel is typically divided into three key stages, each with its own performance benchmarks. Starting with the visitor-to-lead stage, conversion rates average 1.5–2.5% for B2B SaaS companies [2]. This is the point where visitors decide whether to engage further with your product.
Once a lead is captured, the MQL-to-SQL (marketing-qualified lead to sales-qualified lead) stage averages a conversion rate of 32–40% for SaaS businesses. This is notably higher than the general B2B average of 13% [2]. Moving further down the funnel, the SQL-to-close rate - where sales-qualified leads become paying customers - lands between 20–25%, meaning about a quarter of SQLs convert into customers [2].
For companies employing trial-based models, the median free-to-paid conversion rate stands at 8% as of January 2026 [1]. However, this figure varies significantly depending on the trial structure. Opt-in trials (no credit card required) show an average conversion rate of 18.2%, while opt-out trials (credit card required upfront) soar to 48.8% [1]. Trial duration also plays a role: 7-day trials achieve the highest conversion rate at 40.4%, whereas trials lasting over 60 days see a drop to 30.6% [5].
These statistics provide a baseline for understanding how average SaaS companies perform and set the stage for comparing them to the top 10% of performers.
Average vs. Top 10% Performance
The difference between average and top-performing SaaS companies is striking. Top-tier companies convert visitors at nearly 6x the rate of their average counterparts [2][4]. Here's how the numbers stack up across the funnel:
| Funnel Stage | Bottom 25% | Average | Elite (Top 10%) |
|---|---|---|---|
| Visitor-to-Lead | <0.7% | 1.5–2.5% | 8–15% |
| MQL-to-SQL | <20% | 32–40% | 39–40%+ |
| SQL-to-Close | <15% | 20–25% | 30%+ |
For companies following product-led growth strategies, the gap is just as significant:
| Model Type | Good (Average) | Great (Top 10%) |
|---|---|---|
| Freemium (Self-serve) | 3–5% | 6–8% |
| Free Trial (No Credit Card) | 4–6% | 10–15% |
| Free Trial (Credit Card Required) | 25–35% | 50–60% |
These benchmarks highlight areas where many SaaS companies fall short. If your visitor-to-lead conversion rate is below 0.7%, you're in the bottom quartile - approximately 20% of SaaS products are in this category [1]. Achieving top-tier performance often requires more than superficial changes like adjusting button colors. It demands a deeper focus on building trust and reducing friction throughout the funnel.
Understanding these benchmarks is crucial as we move into analyzing conversion rates by industry and marketing channel in the sections to follow.
Conversion Benchmarks by Industry
CRM, Cybersecurity, and HR Tech/Edtech Conversion Rates
Looking at benchmarks across industries, conversion rates vary widely depending on the sector. These differences often stem from factors like the complexity of the buying process, the number of decision-makers involved, and the perceived risks tied to the purchase.
CRM platforms tend to shine in the middle and bottom stages of the sales funnel. They boast a 9.7% visitor-to-trial conversion rate [2][10], one of the highest in the SaaS world. Once a prospect begins a trial, CRM tools convert at an average rate of 29.0%, which climbs to 31.4% in 2026 projections [9][10]. This strong performance is largely due to the clear and immediate benefits these platforms offer, such as simplifying pipeline management and tracking revenue - features that resonate strongly with sales teams.
Cybersecurity, on the other hand, faces more hurdles. Visitor-to-lead conversion rates hover between 1–2% [2], significantly lower than other industries. This challenge is linked to the lengthy evaluation processes and the need for multiple stakeholders to weigh in. However, once a lead is qualified, cybersecurity companies excel with a 39% opportunity-to-close rate [10]. Their trial-to-paid conversion averages 22%, with top-performing companies exceeding 25% [7][8].
HR Tech benefits from prospects who often arrive with high intent, ready to explore demos. This results in visitor-to-lead rates of 3–6% [2], which is about double the average for cybersecurity. The trial-to-paid conversion rate for HR Tech stands at 22.7% [10]. Meanwhile, Edtech shows strong engagement at the top of the funnel, with a 10.3% visitor-to-trial rate [2][10]. However, it struggles to convert freemium users, with a freemium-to-paid conversion rate of just 2.6% [10], the lowest among the industries analyzed.
Industry Comparison Table
| Industry | Visitor-to-Lead | Visitor-to-Trial | Trial-to-Paid | Freemium-to-Paid |
|---|---|---|---|---|
| CRM | 2.0% | 9.7% | 29.0–31.4% | 3.4% |
| Cybersecurity | 1.0–2.0% | 7.4% | 22.0% | 3.3% |
| HR Tech | 3.0–6.0% | 8.1% | 22.7% | 3.6% |
| Edtech | 1.4% | 10.3% | 24.8% | 2.6% |
This table highlights the conversion trends across these industries. For example, cybersecurity companies with visitor-to-lead rates below 1% may need to refine their top-of-funnel strategies. Similarly, CRM providers with trial-to-paid rates under 29% should focus on improving onboarding and activation processes to maximize their potential.
Conversion Rates by Marketing Channel and Growth Model
SEO, PPC, and LinkedIn Conversion Rates
The performance of marketing channels plays a huge role in lead conversion. SEO stands out with a 2.1% visitor-to-lead conversion rate, which is nearly three times higher than paid search. Once leads are in the funnel, SEO-sourced leads move from Marketing Qualified Lead (MQL) to Sales Qualified Lead (SQL) at a rate of 51%, compared to PPC’s 26% [5][10].
LinkedIn also performs strongly, delivering a 2.2% visitor-to-lead conversion rate and an impressive 113% ROI - outpacing Google Ads' 78% ROI. This is despite LinkedIn’s slightly higher average cost per click ($5.58–$10.00 versus $5.34). LinkedIn leads progress from SQL to opportunity at a 41% rate and close at 39% [5][10].
PPC, however, lags behind with an average visitor-to-lead conversion rate of just 0.7%. That said, high-intent campaigns targeting specific pain points can push PPC conversion rates to the 3–5% range [2]. Even so, PPC’s MQL-to-SQL conversion rate is about half of SEO’s [5].
These channel-specific metrics provide a foundation for comparing broader growth strategies.
Product-Led Growth vs. Freemium Models
Product-led growth models often deliver much higher activation rates compared to traditional sales-led strategies. Companies leveraging this approach typically see activation rates ranging from 25% to 40% [2]. By tracking Product-Qualified Leads (PQLs) based on in-app behavior, free-to-paid conversion rates can climb to 30–39% [1].
Freemium models, while effective at generating signups, tend to have lower conversion rates. The median freemium-to-paid conversion rate is about 5.5%, with many achieving 3–5%, and top performers hitting 8–12% [7][1]. In contrast, free trials requiring a credit card convert at a median rate of 30%, with top companies reaching 50–60% [7][1].
"A 3% rate can be perfectly fine if you have high traffic, low acquisition cost, and strong expansion revenue. A 15% rate can be a disaster if your traffic is expensive and customers churn after three months" [1].
Selecting the right growth model depends on factors like acquisition costs and the complexity of your product. Freemium models are ideal for nurturing a broad user base over time, while credit card–required trials are better suited for scenarios where traffic is expensive, and immediate revenue validation is critical.
2026 Trends and How to Improve Your Conversion Rates
Using AI Personalization to Increase Conversions
AI personalization is changing the game for SaaS companies looking to boost conversions. A whopping 68% of CRO professionals now use AI personalization tools, and the results are hard to ignore: real-time personalization can lead to a 40% increase in conversion rates, while personalized CTAs outperform default ones by an incredible 202% [4].
AI-powered and hybrid products are pulling ahead, with 15–20% conversion rates, compared to the 10–15% seen in traditional SaaS offerings [8][7]. This edge comes from AI’s ability to cut time-to-productivity by 40% and reduce errors by 80% [4]. Companies that implement AI effectively see average revenue growth of 10–15%, with top performers hitting 25% [4].
How can you leverage AI? Use it to identify Product Qualified Leads (PQLs) by analyzing user behavior and triggering upgrade prompts when users hit feature limits or usage caps [7]. AI can also help generate variations of headlines and copy, but it’s best to refine these manually to maintain your brand’s voice and emotional appeal [4].
"AI handles pattern recognition and variation generation. It struggles with brand voice, emotional nuance, and understanding why a customer hesitates." - Cam Rickerby, Founder, Arclen [4]
Another key strategy is focusing on the "2-Minute Benchmark" - automating onboarding so users experience your product’s core value within two minutes of signing up [7]. However, tread carefully: 52% of consumers lose trust when content feels AI-generated, so seamless integration is crucial [4].
While personalization is a powerful tool, don’t overlook the impact of pricing strategies and trial design on conversion rate optimization.
How Pricing Transparency and Trial Length Affect Conversion
Trial length plays a big role in conversion success. For example, 7-day trials convert at 40.4%, but extending trials beyond 61 days drops conversion rates to 30.6% [4][9]. A sweet spot? 14-day trials with structured check-ins on Day 3 and Day 7, which can push conversion rates to 44.1% [9].
The decision to require a credit card upfront also has a huge impact. Opt-out trials (where a card is required) average 48.8% conversion rates, while opt-in trials (no card required) average just 18.2% [11][4][1]. However, requiring a card upfront can reduce the number of signups. For every 1,000 visitors, credit card trials yield 10.5 paying customers, compared to 3.6 without a card [8].
Take Canva, for instance. In January 2026, they improved trial-to-paid conversions by sending notifications 7 days before Pro trials ended. This approach eased users’ concerns about forgotten subscriptions, encouraging them to provide credit card details upfront while also improving retention in the first three months [8].
Transparent pricing models consistently outperform "Contact Sales" approaches, converting 15–25% better for self-service SaaS. Adding social proof to pricing pages, such as testimonials or case studies, can improve conversions by 15–25%, while video testimonials near CTAs drive an impressive 80% lift [4]. Ultimately, the quickest way to better conversions is delivering value fast - ideally within the first 7 days [11].
These strategies take on different dynamics when comparing enterprise and mid-market segments.
Enterprise vs. Mid-Market Conversion Gaps
Enterprise and mid-market segments show clear differences in conversion patterns. Enterprise conversion rates are 50% lower at the top-of-funnel than mid-market, largely due to longer evaluation periods and the involvement of larger buying committees. In 2026, enterprise deals average 13 decision-makers per deal, while mid-market deals involve much smaller groups [12].
Let’s look at the numbers: Visitor-to-lead conversion rates are 0.7% for enterprise, compared to 1.4% for mid-market. Similarly, median win rates are 15% for enterprise deals (over $100K ACV) and 24% for mid-market deals ($10K–$50K ACV) [12][6]. Sales cycles also differ significantly, with enterprise deals taking 120–170+ days, while mid-market deals close in 30–120 days [2][6][13].
What can help? Engaging at least three contacts per deal can boost close rates by 2.4x - and even 3.1x for enterprise deals [12]. Speed matters too: responding to inbound interest within 5 minutes correlates with a 21% higher win rate [12].
PQLs are another game-changer, converting at roughly 3x the rate of Marketing-Qualified Leads (MQLs) [1]. Automating lead qualification and scoring based on product usage can improve funnel velocity by 25–30% [6]. However, the MQL-to-SQL stage remains a challenge, with only 13% making it through, and 63% of enterprise deal losses occurring during discovery and qualification [12].
These insights highlight how tailored strategies can bridge the conversion gap across different market segments.
How to Use These Benchmarks to Grow Your SaaS
What the Data Tells Us About SaaS Conversion in 2026
The numbers paint a clear picture of SaaS conversion trends in 2026. For starters, conversion rates vary significantly depending on your model. Freemium models typically see conversion rates of 3–5%, while trials requiring a credit card should aim for 25–35%. This highlights how essential it is to benchmark your performance against the right model[1].
Another key takeaway? Activation trumps acquisition. The average activation rate for SaaS companies is 37.5%, and improving this by just 25% can drive a 34% revenue boost[4]. With trial-to-paid rates on the decline, speeding up how quickly users experience their "aha moment" is more important than ever.
Lastly, the MQL-to-SQL (Marketing Qualified Lead to Sales Qualified Lead) stage remains a major hurdle. Conversion rates here hover between 13–21% for most B2B SaaS companies[3]. However, companies tracking PQLs (Product Qualified Leads) see conversion rates that are three times higher than those relying solely on MQLs[1].
With these trends in mind, let’s explore actionable steps to close the gap between where you are and where you want to be.
What to Do Next
To start improving, focus on optimizing your funnel to capture missed opportunities. It’s crucial to benchmark against your specific model rather than relying on generic industry averages. For example, top-performing SaaS companies convert visitors to signups at a rate of 8–15%. Compare that to the average of 1.5–2.5%, and you’ll see why identifying the weakest link in your funnel is so important. A thorough audit can reveal leaks, whether in the visitor-to-signup stage or in activation, where streamlining the path from signup to value can deliver quick wins[2][4].
Simplifying your landing pages can also make a big difference. Aim for a 5th–7th grade reading level using tools like Hemingway Editor. Pages written at this level boast conversion rates of 12.9%, compared to just 2.1% for pages filled with technical jargon[4]. Keep your forms short - 3–5 fields is the sweet spot. When forms go beyond 7 fields, abandonment rates skyrocket to 67.8%[4].
Another game-changer? Start tracking PQLs. These focus on identifying high-intent users based on how they interact with your product, rather than relying solely on demographics. Given that only 24–25% of SaaS companies currently track PQLs, adopting this approach can give you a major competitive edge[1].
Finally, prioritize testing your pricing page. Since this page often signals the highest purchase intent, even small adjustments can lead to big gains. Quarterly tests can improve pricing page conversions by 12–18%[4].
FAQs
::: faq
Which conversion benchmarks should my SaaS compare against?
Your SaaS business can benefit from comparing its conversion rates to industry-specific benchmarks. Here's a quick snapshot of key metrics:
- Visitor-to-lead rates: Typically range between 1–7%.
- MQL-to-SQL rates: Fall within 13–21%.
- Trial-to-paid rates: Hover around 12–35%.
- Demo-to-close rates: Land between 22–30%.
Top-performing companies often exceed these numbers by implementing targeted strategies. Use these benchmarks as a guide to evaluate your current performance and identify areas for improvement. :::
::: faq
Should I require a credit card for my free trial?
Requiring a credit card for free trials can significantly improve the percentage of users who transition from trial to paid plans - some studies even suggest it could double conversion rates. On the flip side, this approach tends to lower overall signups, with a potential drop of around 65%. The key is to carefully evaluate this trade-off and decide what works best for your business objectives. Would you prefer a smaller pool of highly committed users or a larger audience with less immediate commitment? The answer depends on your goals. :::
::: faq
How do I define and track PQLs in my product?
Defining and keeping track of Product Qualified Leads (PQLs) means identifying free users who demonstrate enough engagement or product usage to be considered strong candidates for becoming paying customers. To do this effectively, focus on key metrics like:
- PQL Volume: The total number of users who meet your PQL criteria.
- PQL Rate: The percentage of free users who qualify as PQLs.
- PQL-to-Paid Conversion Rate: How many PQLs eventually convert into paying customers.
By analyzing these metrics, you can zero in on the free users most likely to make the leap to paid plans. This allows for more targeted nurturing efforts and personalized outreach, which can significantly improve your overall conversion rates. :::
Go deeper than any blog post.
The full system behind these articles—frameworks, diagnostics, and playbooks delivered to your inbox.
No spam. Unsubscribe anytime.