User Activation Rate: How to Find and Fix Your SaaS Aha Moment
Pinpoint your SaaS aha moment and streamline onboarding to increase activation and retain users.
User Activation Rate: How to Find and Fix Your SaaS Aha Moment
Struggling with low SaaS user engagement? It often boils down to one thing: activation. User activation is when a new user first experiences your product’s value - what’s often called the "aha moment." But here’s the challenge: only 36% of users typically activate, leaving 64% of your acquisition efforts wasted.
Improving activation isn’t just about getting users to stick around - it’s a direct revenue driver. For example, boosting your activation rate by 10% can often deliver more impact than increasing signups by the same amount. The key? Identifying your product’s aha moment and guiding users to it as fast as possible.
Quick Takeaways:
- Aha Moment: The point where users understand your product’s value.
- Why It Matters: Activated users are more likely to engage, upgrade, and refer others.
- How to Improve: Use analytics, user surveys, and onboarding tweaks to optimize the path to activation.
Let’s break down how to uncover and optimize your SaaS aha moment step-by-step.
::: @figure 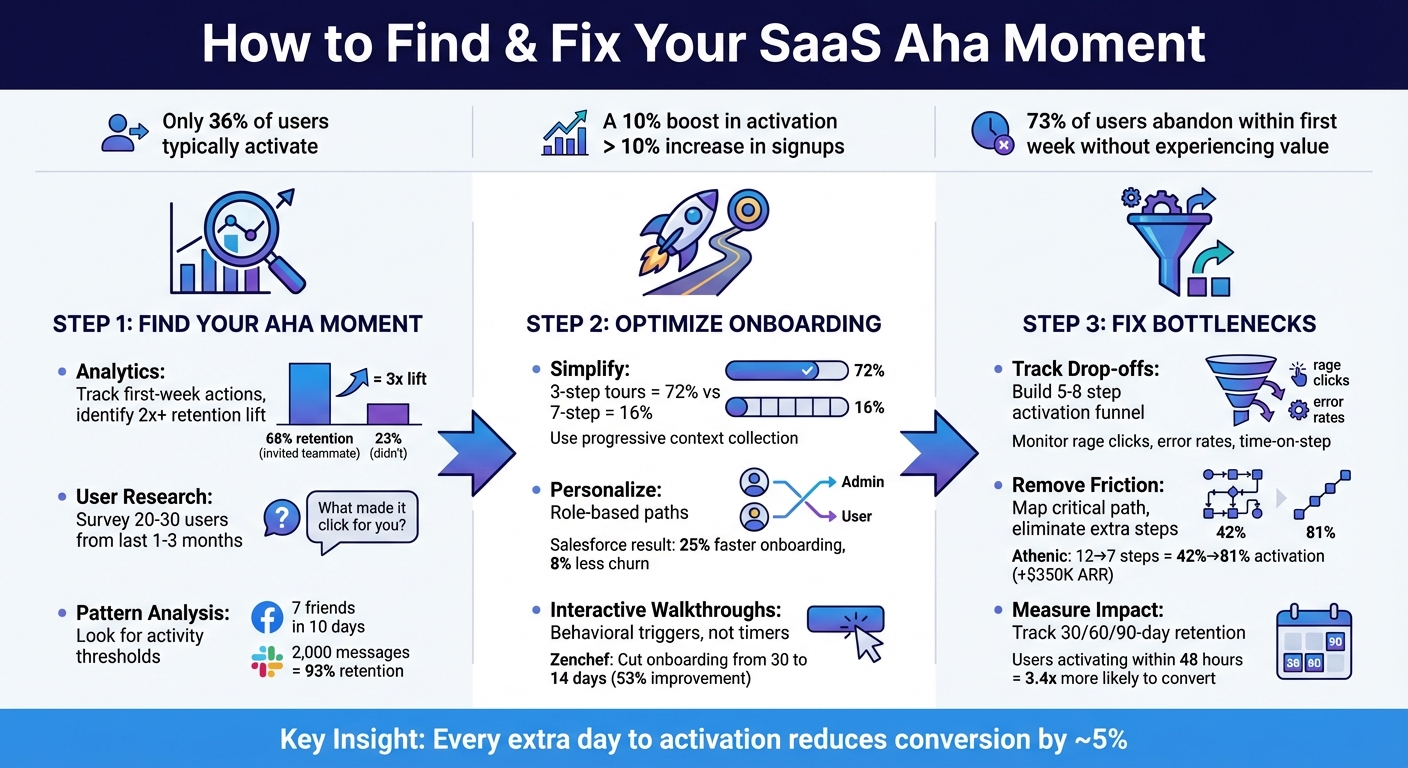 :::
:::
How to Measure & Improve User Activation | Emilia Korczyńska
::: @iframe https://www.youtube.com/embed/GsjJIFB4-TY :::
sbb-itb-0499eb9
How to Find Your SaaS Aha Moment
Pinpointing your SaaS aha moment involves systematically analyzing user behavior to uncover the actions that separate engaged users from those who churn. The ultimate goal? Identify the specific action that strongly correlates with long-term retention. If you find an action that boosts retention by 2x or more, you’re likely on the right track.
Use Analytics to Track User Behavior
Start by listing key first-week actions - things like creating items, inviting teammates, connecting integrations, uploading files, or completing setup steps. Then, dive into a correlation analysis to figure out which actions set retained users apart from those who churn. For instance, if 68% of users who invited a teammate remain active after 30 days, compared to just 23% of users who didn’t, that 3x lift signals a strong candidate for your aha moment [3].
Session replays are another goldmine. Reviewing replays of activated users can help you identify specific UI triggers. For example, you might notice users pausing before clicking a button and then displaying a burst of activity afterward - something that aggregate data alone might miss [6].
It’s also helpful to segment your data by user persona. Different roles often have different aha moments. For example, Managers might experience theirs when assigning the first task, while Individual Contributors might feel it when completing their first project [1]. While analytics show what users are doing, you’ll need direct feedback to understand why those actions matter.
Survey and Interview Your Users
While analytics provide the numbers, surveys and interviews reveal the reasons behind them. Use a microsurvey right after a key activation milestone to capture user insights. Ask questions like, "What made it click for you?" to understand how users perceive the value of your product [7].
Focus on users who joined in the last 1–3 months, as their initial experience is still top of mind [8]. Don’t limit your interviews to activated users - talk to non-activated users too. Ask them, "What’s the main reason you haven’t set this up yet?" to uncover hidden points of friction [7].
"Improvements in a user's first 5 minutes can drive a 50% increase in lifetime value." - KickOffLabs [8]
Generally, interviewing 20–30 users is enough to reach thematic saturation and gather actionable insights [9]. Once you’ve collected this feedback, compare it with your activation metrics to validate your findings.
Analyze Patterns in Activation Metrics
Look for consistent activity thresholds rather than one-off events. A classic example comes from Facebook in 2012: Chamath Palihapitiya, their Growth Lead, discovered that users who added 7 friends in 10 days were much more likely to stick around long-term [3]. Similarly, Slack found that teams sending 2,000 messages had a 93% retention rate [3].
Define a retention window - Day 7 for daily-use tools, Day 30 for weekly-use tools - and analyze early behaviors of users who meet that threshold [3]. Compare retention rates for different actions to identify the one with the most significant impact. This is likely your aha moment.
You can also track when user activity levels off, signaling that they’ve realized the product’s value. For example, at pgMustard, founder Michael Christofides monitors how many users successfully review 1, 2, and 5 query plans within weekly cohorts to measure activation as a proxy for user experience [6].
How to Optimize Your Onboarding Flow
Once you’ve pinpointed your aha moment, the next step is simple: redesign your onboarding process to guide users to that moment as quickly as possible. Why? Because 73% of SaaS users abandon a product within the first week if they don’t experience its value [12]. Every extra step or confusing screen is an opportunity for users to drop off. By streamlining the path to that key moment, you’ll turn sign-ups into engaged users.
Simplify Sign-Up and Onboarding Steps
The fewer obstacles between sign-up and the aha moment, the better. Avoid bombarding users with unnecessary questions upfront. Instead, try progressive context collection - gather information gradually as users interact with the product [11]. This approach minimizes friction while still allowing for personalization later.
Save non-essential tasks for after users see value. For example, Salesflare CRM introduced a micro-task sequence: Connect Email → Import Contacts → Send Tracked Email. Users who completed the final step were 45% more likely to activate [12]. Each task should build toward the ultimate goal.
Tour length also plays a big role in engagement. Shorter walkthroughs perform far better - three-step tours have a 72% completion rate, while seven-step tours drop to just 16% [5]. For more complex setups, consider breaking walkthroughs into smaller, feature-specific chunks rather than overwhelming users with a single long sequence.
Personalize the User Journey
Use segmentation data to customize the experience for different types of users. For instance, a sales rep’s first win might be sending a tracked email, while a manager’s could be assigning a task to their team. Dynamic routing ensures each persona gets an interface tailored to their needs [5][11].
This kind of personalization accelerates activation. In November 2025, Salesforce introduced role-based onboarding for Salesforce Lightning, creating distinct paths for Sales Reps, Managers, and Admins. The results? Onboarding time dropped by 25%, churn decreased by 8%, and Net Promoter Scores improved by 12 points [12]. The secret was focusing on what each role needed to achieve first while cutting out unnecessary steps.
You can implement personalization using tools that enrich user data or by simply asking users to define their own path [5]. For high-value customers, offering one-on-one onboarding calls can further boost activation rates [10]. Whether automated or hands-on, the goal is the same: turn a generic onboarding process into a tailored experience that guides users toward success.
Use Interactive Walkthroughs and Tooltips
Interactive walkthroughs are a game-changer. Unlike passive tutorials, these require users to actively engage with the product. Instead of just clicking “Next” through a series of steps, users perform meaningful actions - like creating their first project or sending their first message [13][14].
Take Zenchef, for example. In 2025, this restaurant reservation platform overhauled its onboarding process. Previously, their 30-day manual onboarding was linked to high churn rates. By replacing manual customer success efforts with interactive walkthroughs, they slashed onboarding time to 14 days - a 53% improvement - and reduced support tickets significantly [14].
"We know that if onboarding takes more than 30 days, we are twice as likely to lose that customer within six months."
– Florian Labadens, SVP Product, Zenchef [14]
Timing is everything. Use behavioral triggers to launch walkthroughs at the right moment - like when a user first accesses a feature - rather than relying on fixed timers [13][14]. And always include a skip option. Forcing experienced users through unnecessary tours only adds frustration [13][14]. Focus on value: instead of “Click here to add a task,” try “Assign your first task so your team knows what to do today” [13].
Different tools work for different scenarios. Hotspot beacons (small, pulsing indicators) highlight underused features without being intrusive [5][13]. Slideouts provide secondary prompts, such as encouraging users to install a browser extension [5]. Contextual empty states use blank screens in new accounts to explain features and offer clear next steps [14]. Choosing the right tool for each moment ensures a smoother, more engaging experience.
How to Fix Common Activation Bottlenecks
Even after optimizing your onboarding flow, activation bottlenecks can still trip up new users. These hurdles go beyond sign-up issues and often follow predictable patterns. Addressing them can lead to significant improvements in user engagement and retention. And it’s worth the effort - 95% of new app users drop off within the first 90 days [17].
Common Activation Bottlenecks
One major challenge? Account creation friction. Long sign-up forms, mandatory phone numbers, or requiring email verification before users can even explore the product are huge turn-offs [15]. People want to experience the value first, not deal with unnecessary hoops.
Another issue is empty states - those blank screens that greet users with no data or direction. This leads to choice paralysis, where users don’t know what to do next, so they simply leave [15]. On top of that, lengthy tutorials can also be a dealbreaker. Every extra day it takes users to hit activation reduces their eventual conversion rate by about 5% [18].
To tackle these problems, use funnel drop-off tracking to see where users are getting stuck. Build an activation funnel with 5–8 key steps, then pinpoint where most users drop off [16]. Pair this with friction signal monitoring - watch for rage clicks, high error rates, or unusually long times spent on specific steps [16]. Tools like session replays and support ticket analysis can help you understand the reasons behind these numbers [16].
How to Remove Friction
Start by mapping out the critical path - the fewest steps needed to get users to their aha moment. Eliminate anything extra along the way [2][17]. For example, in August 2025, Athenic cut their onboarding steps from 12 to 7 and added Google SSO. This reduced the median time-to-activation from 8.2 days to just 1.6 days, boosting activation rates from 42% to 81%. The result? Trial-to-paid conversions jumped from 8% to 22%, adding about $350K in annual recurring revenue [18].
Another tactic is progressive disclosure - show users only what they need to know at each step. This prevents them from feeling overwhelmed [2][17]. A great example comes from pgMustard’s founder, Michael Christofides. He found that 50% of users failed to submit a query plan due to formatting issues. Instead of just improving the documentation, he updated the product to accept multiple input formats. The result? Activation rates jumped from 55% to 75% almost overnight [6].
Progress indicators like checklists or progress bars can also work wonders. They tap into the Zeigarnik effect, making users feel compelled to complete the process [18]. By removing these barriers, you can extend the benefits of smooth onboarding into sustained activation. And here’s a key stat: users who hit their aha moment within 48 hours are 3.4 times more likely to convert to paid plans compared to those who take a week or longer [18].
"The winners in any category are usually the ones who moved fastest, not the ones who were first. Speed of learning and iteration matters more than timing."
– Patrick Collison, CEO, Stripe [18]
How to Measure the Impact of Changes
To accurately measure activation rates, wait until the full activation window (typically 7 or 14 days) has closed for all users in a cohort [2]. Measuring too early can lead to misleading results.
Track time-to-value (TTV) by looking at both the median and the 75th percentile for how long it takes users to reach their first aha moment [16]. This helps you identify friction points, especially for users who take longer to activate. But don’t stop at activation rates alone - monitor 90-day retention to ensure your changes lead to meaningful, lasting activation [2][16].
Build a detailed activation funnel with 5–8 critical steps. For each step, track completion rates, the median time between steps, and drop-off rates [16]. Also, compare activation-qualified conversions - the trial-to-paid rate for users who reach activation versus those who don’t. This will confirm if your activation milestone truly predicts success [16].
A small improvement in activation rates can have a big impact. For example, a 10% increase in activation often drives more revenue than a 10% boost in sign-ups [2]. Plus, context-triggered help (like tips or prompts that appear when users need them) outperforms static tutorials by over 30% in driving feature adoption [12]. These aren’t minor tweaks - they’re key to turning your product into a growth engine.
"Every SaaS product has a moment where a new user goes from curious to committed. Your activation rate - the percentage who reach it - is one of the most powerful levers for growth."
– KISSmetrics Editorial [2]
Conclusion: Improve Activation Through Continuous Testing
Key Takeaways
Refining your product's aha moment is a continuous effort. Start by using cohort analysis to pinpoint the activation event that aligns most closely with retention. Then, map out the critical path leading to that moment and eliminate unnecessary steps along the way. To validate your changes, monitor 30-, 60-, and 90-day retention metrics to ensure they lead to sustained user engagement. And as your product evolves, revisit and adjust your activation definition annually [2].
Even small gains in activation can have a noticeable effect on revenue [2]. By regularly fine-tuning your activation strategy with the help of data insights and user feedback, you create a solid foundation for ongoing growth.
"Don't assume your product is self-evident, no matter how easy you make it. Identify the precise moment new users get it."
– Amit Ashwini, Founder, DataDab [4]
Armed with these insights, you can set your team up for success with strategies designed for long-term impact.
How Artisan Strategies Can Help
Artisan Strategies specializes in helping SaaS companies discover and enhance their activation moments through focused, data-driven approaches. Whether you're struggling with low activation rates, a confusing onboarding process, or retention issues, we can craft a tailored plan to turn trial users into loyal customers. From conducting behavioral cohort analysis to redesigning onboarding experiences, we collaborate with you to identify pain points and implement solutions that deliver measurable results.
FAQs
::: faq
How do I define activation for my SaaS?
Activation is all about identifying the key action or milestone that signals a user has discovered your product's core value - often referred to as the "Aha moment." This isn't just a feel-good moment; it's about focusing on measurable behaviors that indicate a user is likely to stick around for the long haul. Think actions like completing a critical task or hitting an important feature milestone.
How do you find this "Aha moment"? By digging into your user data. Analyzing patterns and behaviors can help you zero in on that pivotal action. Once identified, you can tweak and refine your onboarding process to guide users toward this milestone, boosting your activation rates. :::
::: faq
How many users do I need to analyze to find the aha moment?
To pinpoint patterns and confirm assumptions about your product's "aha moment", it's essential to analyze a representative sample of your user base. The specific size of this sample will vary depending on your product and the number of users you have. However, the goal is to gather enough data to clearly distinguish the actions and behaviors of users who stick around from those who don’t. :::
::: faq
How do I prove an onboarding change improved revenue?
To demonstrate that an onboarding adjustment has boosted revenue, focus on tracking key metrics such as activation rate and time-to-value. You can compare data from before and after the change or conduct A/B tests to evaluate improvements in activation, engagement, and trial-to-paid conversions. Additionally, keep an eye on long-term retention and revenue trends. Faster time-to-value and higher activation rates often lead to sustained revenue growth, making these metrics critical for measuring success. :::
Go deeper than any blog post.
The full system behind these articles—frameworks, diagnostics, and playbooks delivered to your inbox.
No spam. Unsubscribe anytime.