Customer Acquisition Cost by Industry: 2026 Benchmarks for 40 Verticals
2026 CAC benchmarks for 40 industries—B2B vs B2C averages, channel costs, and practical ways to lower acquisition spend.
Customer Acquisition Cost by Industry: 2026 Benchmarks for 40 Verticals
Customer Acquisition Cost (CAC) is a key metric that reveals how much it costs to acquire a new customer. By 2026, CAC has risen 60% since 2021 due to higher ad costs, privacy regulations, and longer sales cycles. Understanding your CAC is crucial for staying competitive and securing funding, especially as efficiency metrics now dominate investor decisions.
Key Takeaways:
- Rising Costs: CAC has increased 260% over the last 9 years.
- Benchmarks Across Industries: CAC varies widely by sector:
- B2B SaaS: $341 (organic) vs. $702 (paid)
- E-commerce: $81 (paid channels)
- Fintech: $1,450 (average)
- Efficient Channels: Organic acquisition costs 30–50% less than paid channels.
- Investor Expectations: A CAC payback period under 12 months and an LTV:CAC ratio of at least 3:1 are now standard for funding rounds.
How to Improve CAC:
- Include all costs (salaries, tools, overhead) in your CAC calculation.
- Shift budgets from underperforming paid channels to organic or referral programs.
- Focus on expansion revenue - upselling existing customers costs half as much as acquiring new ones.
- Use AI for predictive lead scoring and campaign optimization to cut costs by up to 47%.
Efficient customer acquisition is no longer optional - benchmark your CAC against industry standards and refine your strategy to thrive in 2026.
::: @figure 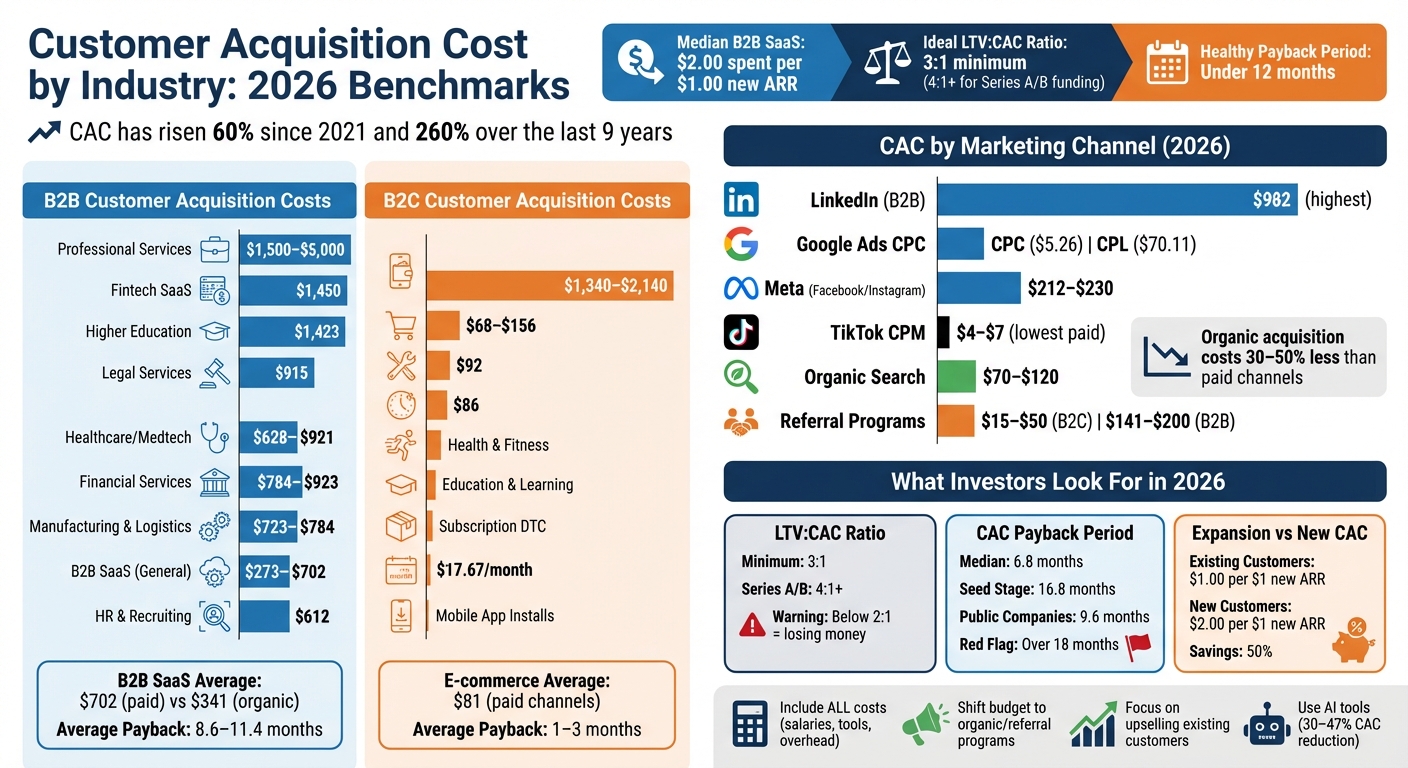 :::
:::
What Is Customer Acquisition Cost (CAC)? Digital Marketing Metric Definitions
::: @iframe https://www.youtube.com/embed/_6oACNwTLfM :::
sbb-itb-0499eb9
Core Metrics for Measuring CAC
To fully grasp Customer Acquisition Cost (CAC), it's essential to examine related metrics that provide a clearer picture of its long-term viability.
CAC Formula and Related Metrics
At its core, the CAC formula is simple: Total Sales & Marketing Spend ÷ Number of New Customers. However, additional metrics like the LTV:CAC ratio and CAC payback period provide deeper insights into financial health.
The LTV:CAC ratio compares the lifetime value (LTV) of a customer to the cost of acquiring them (CAC). Ideally, this ratio should be at least 3:1 - every dollar spent on acquisition should return three dollars in lifetime value. By 2026, investors are raising the bar, often expecting a 4:1 ratio or higher for Series A and B funding rounds [1][4]. Falling below a 2:1 ratio suggests you're losing money on every customer.
"The number that matters most isn't CAC alone -- it's the LTV:CAC ratio and payback period." - Lech Kaniuk, Author of The Two Numbers [1]
The CAC payback period measures how long it takes to recover acquisition costs. As of 2026, the median payback period is 6.8 months, though this varies by company stage. Seed-stage companies average 16.8 months, while public companies typically recover costs within 9.6 months [1]. Companies taking longer than 18 months to break even face increased financial risk.
Two other metrics are worth noting:
- Expansion CAC: This measures the cost of generating revenue from existing customers. In 2026, it’s about half the cost of acquiring new customers, averaging $1.00 per $1 of new ARR compared to $2.00 [1].
- Blended CAC: Offers a big-picture view of overall acquisition efficiency, while channel-specific CAC highlights inefficiencies in individual marketing channels [7].
These metrics provide a framework for assessing cost efficiency across different acquisition strategies.
CAC by Acquisition Channel
The cost of acquiring customers varies significantly by channel, making it critical to benchmark and allocate budgets wisely.
- Google Ads: In 2026, the average cost per click is $5.26, with a cost per lead of $70.11 [1].
- LinkedIn: This platform has the highest B2B CAC at $982, yet it commands 41% of B2B ad budgets due to its precise targeting [1].
- Meta (Facebook and Instagram): CPMs range from $8 to $14, with an average CAC between $212 and $230 [1][7].
- TikTok: A low-cost option with CPMs between $4 and $7 [1].
- Referral and Partner Programs: These generally deliver the lowest CAC, ranging from $15 to $50 for consumer businesses and $141 to $200 for B2B [1].
- Organic Search: Costs between $70 and $120 per customer, making it about 30% cheaper than paid channels for B2C SaaS [1].
A real-world example shows the importance of channel-specific analysis. A subscription apparel brand switched from tracking blended CAC to a channel-specific approach. By identifying a high-retention customer segment, they redirected $40,000 per month toward this group, reducing their CAC payback period from 8 months to just 3 months and adding $220,000 in annual contribution margin [7].
The divide between organic and paid acquisition remains stark. Companies with strong first-party data assets benefit from a 30–50% CAC advantage compared to those relying on third-party data - a trend driven by stricter privacy regulations [1].
B2B Industry CAC Benchmarks
B2B Industries and Their CAC Ranges
Customer acquisition costs (CAC) in the B2B world vary widely depending on the industry. These differences stem from factors like the complexity of sales processes, deal sizes, and regulatory hurdles. For example, the average CAC for B2B SaaS companies is $702, which towers over the B2C average of $68 [6]. That said, the numbers shift significantly across different verticals.
| B2B Industry Vertical | Average CAC | Typical Payback Period |
|---|---|---|
| B2B SaaS (General) | $273–$702 | 8.6–11.4 months |
| Fintech SaaS | $1,450 | 8.2 months |
| Higher Education | $1,423 | 3.8 months |
| Healthcare/Medtech | $628–$921 | 6–24 months |
| Legal Services | $915 | Not specified |
| Financial Services | $784–$923 | 2–6 months |
| Manufacturing & Logistics | $723–$784 | 4–9 months |
| HR & Recruiting | $612 | 10.6 months |
| Professional Services | $1,500–$5,000 | 3–5 months |
Industries with tighter regulations, like fintech, healthcare, and professional services, tend to have higher CAC due to longer sales cycles and compliance requirements. On the other hand, higher education stands out with a relatively short payback period despite its high acquisition costs.
These benchmarks provide a glimpse into the varied landscape of B2B acquisition expenses and the factors that influence them.
What's Driving B2B CAC Changes in 2026
The evolving business environment in 2026 has introduced new factors that are reshaping B2B CAC. Here are three key trends driving these changes:
1. Rising Advertising Costs
Platforms like Google Ads and LinkedIn have seen significant cost increases, which are pushing up overall acquisition expenses [1]. Companies relying solely on paid channels are experiencing CAC growth at twice the rate of those employing more diverse strategies [3].
2. Lengthening Sales Cycles
Industries with heavy regulations, such as fintech and healthcare, are grappling with extended sales cycles. Complex security protocols and approval processes are adding to overhead costs. As a result, the median B2B SaaS company now spends $2.00 to secure every $1.00 of new annual recurring revenue (ARR), marking a 14% rise since 2023 [1][5].
3. Privacy Regulations and First-Party Data
Stricter privacy laws are prompting businesses to pivot toward first-party data strategies. Leveraging product usage data and building engaged communities offers a 30–50% CAC savings compared to relying on third-party data [1]. A case in point: BMC Software improved its conversion rate to 49.5% by focusing on its existing database, showcasing the advantages of nurturing internal resources over chasing new leads [2].
As CAC continues to climb, many companies are finding expansion revenue to be a more cost-effective alternative. It costs just $1.00 to generate a dollar of new ARR through existing customers, compared to $2.00 for acquiring new ones [1]. For instance, PayRight Solutions redirected $250,000 to R&D after realizing that 42% of their CAC was being spent on unresponsive leads. This shift led to an 18% reduction in churn [2].
These emerging trends underscore the importance of adapting acquisition strategies to keep costs in check while maximizing returns.
B2C Industry CAC Benchmarks
B2C Industries and Their CAC Ranges
Consumer-facing businesses face a very different cost structure compared to B2B, with customer acquisition costs (CAC) varying widely across sectors. Below is a breakdown of estimated CAC ranges and typical payback periods for key B2C industries projected for 2026:
| B2C Industry Vertical | Average CAC | Typical Payback Period |
|---|---|---|
| E-commerce / DTC | $68–$156 | 1–3 months |
| Subscription DTC | $17.67 (monthly) | 1–2 months |
| Health & Fitness | $86 | 5.2 months |
| Education & Learning | $42 | 3.8 months |
| Productivity & Tools | $92 | 6.4 months |
| Consumer Fintech | $1,340–$2,140 | 6–18 months |
| Mobile App Installs (NA) | $5.28 | 1–6 months |
Industries with high customer retention or subscription models tend to recover their CAC more quickly. For example, education and learning platforms maintain one of the lowest CAC levels at $42, with a payback period of just 3.8 months. On the other hand, consumer fintech faces much higher CAC, ranging from $1,340 to $2,140, largely due to regulatory hurdles and market complexities [9][1]. Subscription DTC and e-commerce businesses often enjoy faster payback periods, typically between one and three months [1]. These benchmarks provide a starting point for understanding the key factors influencing B2C CAC in 2026.
What's Driving B2C CAC Changes in 2026
The dynamics of customer acquisition costs in B2C industries are changing rapidly. Over the past five years, CAC has jumped by 60%, with a 40% increase in just the last two years, forcing brands to rethink their paid acquisition strategies [10][11].
One major factor is the impact of privacy regulations, which have reshaped targeting methods. Brands leveraging first-party data now experience a 30–50% CAC advantage [1]. This shift highlights the growing importance of customer retention. Acquiring a new customer can cost 5–25 times more than retaining an existing one, and even a modest 5% increase in retention rates can lead to profit gains of 25–95% [10][11].
Artificial intelligence (AI) is also transforming the competitive landscape. Companies embracing AI tools are cutting CAC by 30–47% through techniques like automated creative testing and predictive lead scoring [1][10]. Meta's Advantage+ AI campaigns, for example, deliver 15–25% higher returns on ad spend compared to manual campaigns, and 88% of marketers now use AI in their daily workflows [1][10]. Additionally, AI-driven search results, such as "AI Overviews", now appear in 25.8% of desktop searches in the U.S., altering how consumers discover products [7].
The concept of "agentic commerce" is another emerging trend. By 2028, 33% of companies are expected to use AI agents to make purchases on behalf of customers [11]. This shift pushes brands to optimize their structured data to remain visible to these automated systems. Simultaneously, about 14% of consumers are prioritizing viral trends or TikTok-inspired aesthetics over traditional brand loyalty. This preference can lead to higher churn unless brands quickly convert these customers into VIP or subscription tiers [11].
"The growth-at-all-costs era is definitively over" - Lech Kaniuk, author of The LTV-CAC Operating System [1]
SaaS CAC Analysis and Artisan Strategies Insights
SaaS CAC by Business Segment for 2026
Customer acquisition costs (CAC) in SaaS can vary widely depending on the target audience and deal size. Here's a breakdown of the median CAC, payback periods, and LTV:CAC ratios by segment for 2026:
| Segment | Median CAC | Healthy Payback Period | Median LTV:CAC |
|---|---|---|---|
| SMB (<$10K ACV) | $4,800 | 6–14 months | 2.8:1 |
| Mid-Market ($10K–$100K ACV) | $18,000 | 12–22 months | 3.6:1 |
| Enterprise (>$100K ACV) | $67,000 | 16–30 months | 4.5:1 |
| PLG / Self-Serve | $1,200 | 3–9 months | 3.2:1 |
The product-led growth (PLG) model stands out with the lowest CAC at $1,200, offering payback periods as short as three months. On the other hand, enterprise deals demand a hefty $67,000 per customer but make up for it with extended payback periods and stronger lifetime value ratios [12].
Efficiency metrics have become critical benchmarks, especially for Series A/B funding rounds. In fact, 91% of term sheets now include them. CAC is flagged as unsustainable if it surpasses 12 months of contract value or if payback periods extend beyond 18 months by the Series B stage [1][12].
With these benchmarks in mind, let’s explore how tailored pricing and onboarding strategies can help SaaS companies trim their CAC even further.
How Artisan Strategies Reduces CAC for SaaS Companies
Artisan Strategies helps SaaS companies cut CAC by focusing on pricing experiments, streamlined onboarding, and refining conversion funnels. In one example, they tested a mix of seat-based, usage-based, and feature-tier pricing models, which boosted checkout conversion by 47% and improved LTV:CAC ratios by 34% [1].
The firm’s results-driven approach aligns with the SaaS industry’s growing focus on efficiency. For instance, they simplified a nine-step signup process into just three screens, leading to a 5× increase in retention. In another case, pricing optimizations unlocked $748,000 in annual revenue by capturing untapped customer willingness-to-pay.
Artisan Strategies takes a hands-on approach, embedding directly with product and growth teams to avoid inefficiencies from handoffs. Their experiment-driven method reflects broader industry trends: companies adopting full-stack AI are cutting CAC by 30–47% through tools like predictive lead scoring and automated campaign management. Meanwhile, businesses focusing on expansion revenue now spend $1.00 per $1.00 of new ARR, compared to $2.00 for acquiring new customers [1].
How to Use These 2026 CAC Benchmarks
Main Findings for B2B and B2C Businesses
Customer acquisition costs (CAC) have skyrocketed - rising by 260% over the past nine years, with a 60% increase in just the last five years [1][3]. By 2026, the median SaaS company is spending $2.00 to acquire every $1.00 of new Annual Recurring Revenue (ARR) [1]. Breaking it down further, B2B SaaS companies average a combined CAC of about $273, while E-commerce businesses see a much lower average of $84 [4]. The difference between acquisition channels is particularly striking: organic search CAC typically falls between $70 and $120, but paid search costs range from $200 to $350 [3].
Investors are now prioritizing efficiency over growth. Efficiency metrics are included in 91% of Series A/B term sheets in 2026, compared to just 43% in 2022 [1]. Companies meeting the Rule of 40 standard enjoy a 129% valuation premium [1]. For B2B businesses, a CAC payback period under 12 months is considered healthy, while anything over 18 months raises concerns about cash flow. On the B2C side, e-commerce businesses generally aim for payback periods of 1–3 months, though rising mobile acquisition costs - up 30–40% due to privacy changes - are creating new challenges [3].
These findings provide a clear framework for refining your acquisition strategies.
Steps to Improve Your CAC
To make the most of these benchmarks and reduce your CAC, start by ensuring your calculations are accurate. Include all sales and marketing costs - this means not just ad spend, but also salaries, tools, agency fees, and overhead [1][13]. Compare this total to your Annual Contract Value (ACV). For B2B companies, your CAC should ideally stay below the first-year ACV to maintain profitability [8]. Another key metric to monitor is your LTV:CAC ratio. A ratio of at least 3:1 is considered sustainable, while anything above 5:1 might indicate you’re under-investing in growth [3][13].
Next, review your budget allocation. Shift funds from underperforming channels to high-performing ones, and diversify beyond paid media. Companies heavily reliant on paid channels have seen CAC rise at twice the rate of those using a mix of paid, organic, and referral strategies [3]. Focus on organic search and referral programs, which deliver CACs between $15 and $50 and have experienced only modest cost increases of 5–10%, compared to the 60% jump in paid media costs [3]. Referral programs, in particular, are a smart investment - referred customers typically achieve a CAC-to-LTV ratio 2.5 times better than those acquired through paid channels [3].
Another way to lower your CAC is by prioritizing expansion revenue. Upselling and cross-selling to existing customers is far more cost-effective, with costs averaging $1.00 for every dollar of new ARR - half the cost of acquiring new customers [1]. Additionally, improving your landing page conversion rates can have a significant impact. For example, doubling your conversion rate from 2% to 4% effectively cuts your CAC in half [8].
Finally, leverage AI tools for predictive lead scoring and campaign optimization. Companies adopting full-stack AI solutions in 2026 are seeing CAC reductions of 30–47% [1].
FAQs
::: faq
What costs should I include when calculating CAC?
When figuring out Customer Acquisition Cost (CAC), make sure to include all marketing and sales expenses directly tied to bringing in new customers. These usually include things like advertising, content creation, sales team salaries and commissions, tools, and agency fees.
However, leave out costs unrelated to customer acquisition, such as product development or general overhead. The key is to focus solely on the expenses that are directly connected to your efforts to acquire customers. :::
::: faq
What’s a good CAC payback period for my industry?
A good CAC (Customer Acquisition Cost) payback period usually lands between 12 and 24 months. The most efficient SaaS companies manage to recover their acquisition costs in less than 12 months, which is impressive. On the other hand, the average payback period tends to fall between 20 and 30 months. These benchmarks provide a helpful reference point for assessing your strategy and setting achievable goals for recovering costs. :::
::: faq
How do I lower CAC without cutting growth?
If you want to reduce your Customer Acquisition Cost (CAC) while still driving growth, the key is to focus on efficiency and boosting your Customer Lifetime Value (LTV). Here are some practical ways to make that happen:
- Streamline onboarding: A smoother onboarding process means customers see value faster, increasing the chances they stick around.
- Automate lead scoring: Use automation to prioritize the most promising leads, saving time and resources.
- Refine targeting: Focus on high-converting channels and audiences to make every marketing dollar count.
- Tackle churn: Reducing churn not only helps retention but also spreads your acquisition costs across a longer customer lifespan.
Another way to cut costs is by switching to flat agency fees, which can help avoid inflated expenses. Plus, sharpening your Ideal Customer Profile (ICP) targeting and addressing churn are quick wins that can improve your CAC metrics almost immediately. :::
Go deeper than any blog post.
The full system behind these articles—frameworks, diagnostics, and playbooks delivered to your inbox.
No spam. Unsubscribe anytime.