Time to Value (TTV): How the Best SaaS Companies Measure and Reduce It
Practical guide to defining, measuring, and reducing Time to Value (TTV) for SaaS — optimize onboarding, track key TTV metrics, and speed customers to their fir
Time to Value (TTV) is the time it takes for a SaaS customer to achieve their first meaningful success with your product. It’s not about completing basic steps like signing up or logging in - it’s about when the product delivers real results that justify their investment. Why does this matter? Because 70% of users abandon software within three months if they don’t experience success.
Key points:
- Faster TTV leads to better conversion rates, retention, and revenue.
- In 2025, SaaS users expected to see value in 1 day, 12 hours, and 23 minutes on average.
- Companies like The Room and Sked Social improved activation rates by up to 75% by focusing on better onboarding processes.
TTV can vary depending on the product:
- Immediate TTV: Minutes (e.g., Grammarly)
- Short TTV: Hours to days (e.g., Canva)
- Medium TTV: Weeks (e.g., QuickBooks)
- Long TTV: Months (e.g., Salesforce)
Reducing TTV involves:
- Defining clear value milestones for customers.
- Simplifying onboarding by removing unnecessary steps.
- Prioritizing high-impact features that drive early success.
- Offering proactive support and personalized guidance.
What Time to Value (TTV) Means for SaaS Products
::: @figure 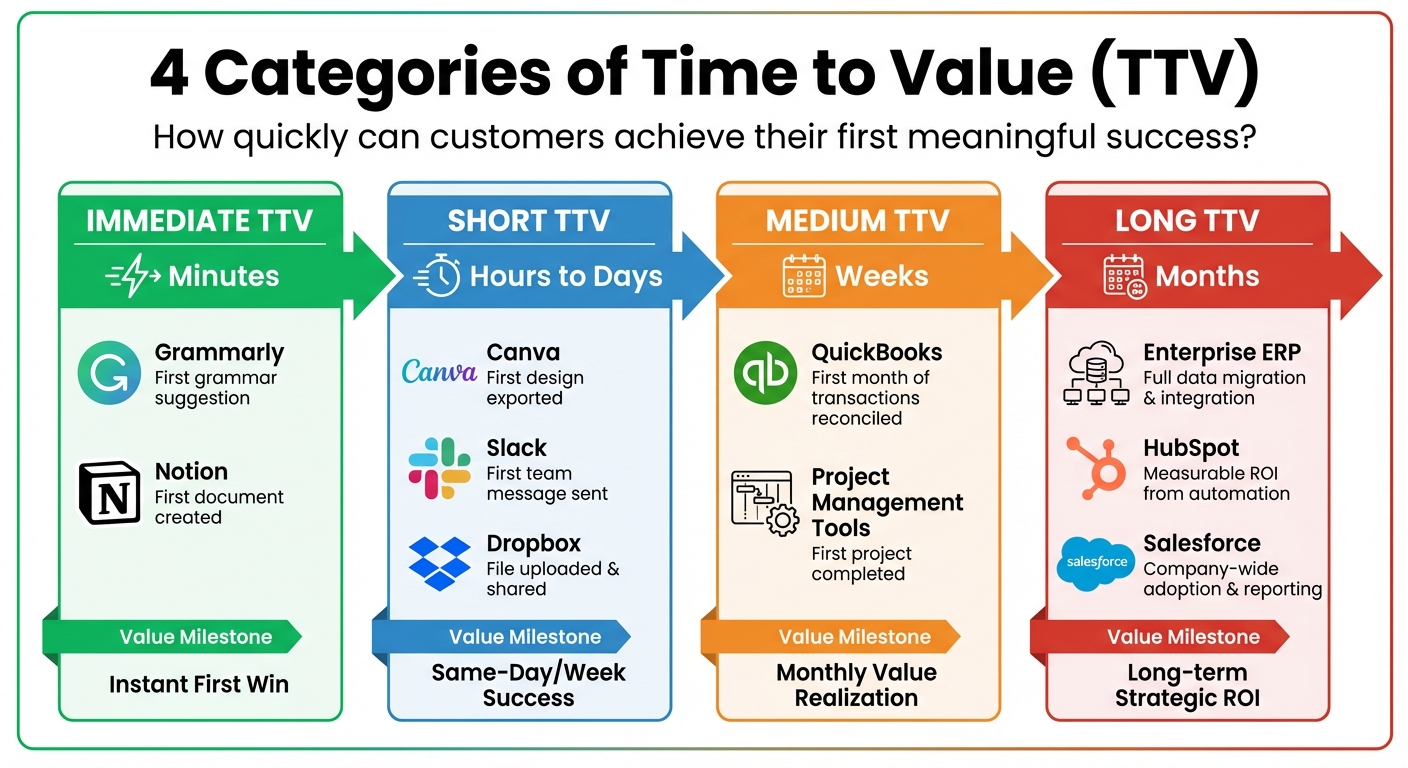 :::
:::
Time to Value (TTV) refers to the time it takes for a customer to go from signing up to achieving their first meaningful success with your product. It’s not about superficial actions like completing a profile or uploading an avatar - it’s about solving the problem they came to solve.
"Time to value (TTV) is the amount of time it takes a new customer to reach their first meaningful outcome with your product." - Onboarding-hub.com [1]
TTV is all about outcomes, not just activity. While the "Aha! moment" is that emotional click when a product suddenly makes sense, TTV is more functional - it’s when the product delivers the result the customer was expecting [5][8].
The key here is perspective. TTV is measured from the customer’s point of view. It’s not about when they hit your internal milestones or contribute to your revenue metrics; it’s about when they feel the product has been worth their time [4].
4 Categories of TTV
TTV can vary depending on how complex the product is and what "value" means for the user.
| Category | Timeframe | SaaS Product Examples | Core Value Milestone |
|---|---|---|---|
| Immediate | Minutes | Grammarly, Notion | First grammar suggestion; first document created |
| Short | Hours to Days | Canva, Slack, Dropbox | First design exported; first team message sent |
| Medium | Weeks | QuickBooks, Project Management Tools | First month of transactions reconciled; first project completed |
| Long | Months | Enterprise ERP, HubSpot, Salesforce | Full data migration; measurable ROI from automation |
- Immediate TTV: Products like Grammarly deliver value instantly. You type, and grammar suggestions appear in seconds - no setup required.
- Short TTV: Tools like Canva allow users to create and export a design in just a few minutes. While quick, it still requires some input and exploration [2][4].
- Medium TTV: Products like QuickBooks take longer because their value builds over time. For instance, you need to reconcile a full month of transactions before seeing the benefits of clean financial reports [1].
- Long TTV: Enterprise platforms like Salesforce can take months. These require data migration, team training, and workflow integration before the full benefits are realized [2][4].
That said, your product's category isn’t set in stone. For instance, Attention Insight, an AI analytics tool, improved its new user activation rate by 47% in six months by introducing interactive walkthroughs. By breaking the value journey into smaller steps, they shortened their TTV [8].
These categories highlight why delivering value quickly is critical for growth.
Why TTV Matters for SaaS Success
Reducing TTV has a direct impact on conversion, retention, and revenue. When users experience value faster, they’re more likely to convert to paid plans, submit fewer support tickets, and stick around longer.
The numbers back this up. Customers who see value within 24 hours have a 21% higher Customer Lifetime Value (CLV) compared to those who take longer [11]. SaaS companies with a TTV under 24 hours also see an 18% higher Net Revenue Retention (NRR) than the industry average [11]. Even trimming TTV by just 20% can drive noticeable improvements in retention and expansion revenue [1].
"The faster a customer experiences meaningful value, the more likely they are to stay and expand their use of the product." - Vincent Gouedard, Fincome [10]
In competitive markets, TTV can be a dealbreaker. Customers often gravitate toward products that deliver results faster [5][9]. With 74% of users willing to abandon a product if onboarding is too complicated, speed to value becomes critical for survival [11].
Quicker TTV also lowers operational costs. Users who see value early on are less likely to flood support teams with "how-to" questions because they’re already succeeding [1][5]. This builds user confidence and reduces unnecessary friction.
Failing to address TTV can lead to silent churn. These are users who sign up, encounter obstacles, never see progress, and quietly move on to a competitor - often without ever reaching out for help.
Next, we’ll dive into how to define what "value" means for your customers to further optimize TTV.
How to Define Value for Your Customers
To effectively reduce Time to Value (TTV), you first need to pinpoint what "value" means for your customers. This isn’t about generic milestones - it’s about identifying the specific outcomes that make customers say, “This product is working for me.”
It’s important to distinguish between activity and actual value. For instance, creating a task in a project management tool isn’t value; completing a project is. Similarly, uploading a contact to a CRM doesn’t equate to value, but closing a deal tracked in that CRM does [1]. Misidentifying milestones can lead to false confidence and hurt retention.
To uncover what truly matters to your customers, combine product analytics with direct customer feedback. Use data to trace the "golden path" - the 3–5 critical actions your most successful customers take shortly after signing up. Then, validate these insights through interviews to identify the moment your product genuinely "clicks" for users [3].
"My favorite example of a TTV metric at Instacart is customers that place an order for perishable items. We found that they are more likely to come back on a recurring basis."
- Daniel Danker, CPO at Instacart [13]
Once you’ve defined what value looks like, break it down into clear milestones that guide your customers’ journey.
Identifying Value Milestones
Defining value is just the start. To make it actionable, break it into three key milestones:
- First Value (the "Aha! Moment"): This is when users first see the potential of your product, even if they haven’t fully achieved their goal. For example, with a grammar tool, the "Aha!" might be seeing the first suggestion pop up as they type.
- Time to Basic Value: This milestone marks the first functional win, like successfully sending an email campaign that generates open rates and clicks [1].
- Time to Exceed Value: This is when the product goes beyond expectations, delivering deeper benefits. For example, a CRM might not only help close deals but also automate repetitive tasks, saving users significant time [14].
These milestones chart the journey from initial curiosity to confidence and eventual product expansion, each requiring tailored support and experiences.
Customizing Value for Different Customer Segments
Not all customers define value the same way. Tailoring your approach to different segments is crucial. For instance, a freelancer might see value in organizing their first client project, while an enterprise team values the ability to collaborate across departments with full visibility into timelines and dependencies.
| Customer Segment | Typical Value Definition (Aha! Moment) | Expected TTV Benchmark |
|---|---|---|
| Self-Serve / Individual | Completing a single core task (e.g., sending an invoice) | < 24–48 hours |
| SMB / Small Team | First successful team collaboration (e.g., first project completed) | 1–2 weeks |
| Enterprise Client | Successful data migration or cross-departmental rollout | 1–6 months |
| Technical Admin | Successful API connection or security configuration | Minutes to Hours |
(Source: OnboardingHub) [1][15]
To effectively customize value, map your top 3–5 customer segments by factors like company size, role, or industry. Then, identify the immediate problem each segment needs to solve. For example, an IT Admin might prioritize successful data integration, while a Sales Manager might focus on generating a forecast report [14][2].
In December 2025, The Room - a professional network platform - introduced in-app onboarding flows guiding new members to upload their CVs, a critical value milestone for their users. Within 10 days of launch, CV uploads increased by 75% [8][7].
This success stemmed from understanding that, for their audience, value meant showcasing expertise, not just creating a profile.
Tailoring value definitions to specific segments also helps manage expectations. Instead of applying a one-size-fits-all TTV, acknowledge that self-serve users may reach value in hours, while enterprise clients might take weeks or months [1][15]. Aligning these timelines with the actual customer journey reduces frustration and boosts retention.
How to Measure TTV: Metrics and Steps
Once you've identified value milestones, the next challenge is figuring out how quickly customers reach them. Without clear metrics, it’s hard to spot delays or confirm progress.
At its core, measuring TTV (Time to Value) comes down to this formula:
TTV = (Date/Time of Value Realization) – (Date/Time of Signup or Activation) [7][17][12]. To make this work, you need to choose the right metrics and track them consistently across your customers.
Key Metrics for TTV
Since value is realized in stages, breaking TTV into categories helps pinpoint where users are getting stuck.
Time to First Value (TTFV) looks at how long it takes for users to achieve their first meaningful result - essentially, the reason they signed up. This could be sending their first email campaign, generating a report, or completing a project. The calculation is simple: Date of First Value Event - Date of Signup [2][17]. For 547 SaaS companies, the median TTFV benchmark is 1 day, 12 hours, and 23 minutes [7].
Time to Perceived Value focuses on the "Aha! Moment" - the point when users grasp your product’s potential, even if they haven’t completed a task yet. This often happens during a demo or while exploring your interface for the first time [7]. While it’s harder to measure directly, you can use proxy events like completing an interactive tutorial or viewing a key feature demo.
Time to Revenue Value is crucial for freemium and trial models. This metric tracks how long it takes for users to find enough value to justify paying. Essentially, it’s your Time to Conversion: Date of Upgrade to Paid - Date of Signup [6]. For subscription businesses, this ties TTV directly to revenue.
Time to Exceed Value measures when users start leveraging advanced features beyond their initial use case. This often leads to plan upgrades or deeper integrations. It’s calculated as: Date of Advanced Feature Adoption - Date of Signup [2][18]. Tracking this helps identify opportunities for expansion and signals strong product engagement.
Tracking TTV in Practice
To measure TTV, you need two timestamps: the starting point (signup or activation) and the moment a meaningful value event occurs (e.g., creating a report or completing a task). The starting point will vary depending on your business model - it could be account creation for self-serve tools, contract signing for enterprise deals, or the upgrade date for freemium users [1][14][17].
When analyzing TTV, focus on medians and percentiles rather than averages. TTV data often includes outliers that can distort averages, making it harder to understand the typical customer experience [14][1]. By looking at the 50th, 75th, and 90th percentiles, you’ll get a clearer picture. For example, if your median TTV is 2 days but the 90th percentile is 30 days, you’ve got a significant group of users struggling to find value.
Segment your data by factors like customer persona, plan type, acquisition channel, or industry. A freelancer using your project management tool will likely see value faster than an enterprise team migrating from older systems. Breaking down these segments can reveal which groups need extra support [14][17].
In 2024, Audi UK used Contentsquare's Error Analysis and Session Replay tools to pinpoint where users encountered friction on their product pages. Automated alerts flagged issues like "rage clicks" and API failures, enabling their team to troubleshoot in real time. This proactive approach boosted conversions by 7% [2].
"Because Contentsquare insights are visual, we spend less time analyzing and more time thinking about what we can do about certain issues."
- Jonny Evans, Conversion Rate Optimization Manager, Audi UK [2]
Combine quantitative analytics with qualitative insights to refine your approach. Use data to identify where users drop off, and tools like session replays or customer interviews to uncover why they’re getting stuck [14][2]. Track TTV by signup cohorts (weekly or monthly) to see if your onboarding improvements are reducing time to value over time [1].
This continuous tracking creates a feedback loop, helping you fine-tune your customer onboarding process.
How to Reduce TTV and Speed Up Customer Success
Once you've measured Time to Value (TTV) and mapped out key value milestones, the next step is eliminating obstacles and focusing on actions that have the most impact. A shorter TTV not only improves customer success but also results in a 25% higher retention rate [21]. Here's how you can make that happen.
Streamlining Onboarding Processes
Simplifying your onboarding process is one of the quickest ways to reduce TTV. Wes Bush, Founder of ProductLed, points out that "well over 30% of required user onboarding steps are rubbish" [20]. Start by auditing your onboarding steps, categorizing them as Green (essential), Yellow (optional, can wait), or Red (unnecessary). Get rid of the Red steps immediately.
Focus on "straight-line onboarding" - a direct path from signup to your user's first success [20]. For example, pre-fill dashboards with sample data or provide templates tailored to specific industries to help users achieve quick wins [16][1].
Appcues learned this the hard way. By analyzing user sessions in FullStory, they found that their welcome message was sending users to a generic dashboard instead of the "aha" page where users experienced value. After redesigning the flow to direct users to the right page, their completion rate improved from 13% to 32%, a 150% increase in activated users [19].
To avoid overwhelming users, use progressive disclosure - only introduce advanced features once users achieve their first meaningful result [21]. Replace passive video tours with interactive, task-driven walkthroughs [3][21], and send behavior-triggered emails to guide users back into the app when needed [19][1].
Once onboarding is seamless, the next step is highlighting the features that matter most.
Prioritizing High-Impact Features
Not all features contribute equally to early success. Onboarding should feel less like a product tour and more like a mission to achieve a specific outcome [3]. The trick is identifying the 3–5 key actions that successful, long-term customers complete soon after signing up.
Use product analytics to uncover these patterns and make them the centerpiece of your onboarding. For instance, in a project management tool, the critical action might be "creating and assigning a task", rather than "logging in" or "setting up a profile" [7]. Tailor the onboarding experience to different personas - what works for a marketer may not work for a data analyst [1][7].
"Your onboarding shouldn't feel like a lecture. It should be a guided mission, purpose-built to get your user to that first win as fast as humanly possible."
This approach keeps users focused and prevents them from being overwhelmed. Once they achieve their first success, they'll be more inclined to explore advanced features independently.
Using Customer Support and Success Teams
After refining onboarding and feature prioritization, reinforce these efforts with proactive customer support. From day one, offer personalized guidance [5]. Customer Success Managers (CSMs) should outline TTV milestones during the initial engagement to align the product's delivery with customer-specific goals [5].
Customer.io tested this by offering a live "concierge" call to 200 new users within two days of signup. This simple step doubled conversion rates [19]. While this high-touch approach works best for premium products, the underlying principle applies universally: proactive support beats reactive problem-solving.
For complex enterprise solutions, consider phased rollouts that deliver an early "quick-win" module [22]. Train internal champions within the customer's organization to accelerate team-wide adoption [5]. Use automated alerts and personalized tips to assist users during critical setup phases [5][22].
Convert frequently asked "how-to" questions into interactive, in-app guides to reduce support requests [3]. This allows your team to focus on strategic conversations instead of repetitive troubleshooting. Celebrate milestones with success messages when users complete key actions, reinforcing the value they've unlocked [3][22]. Data shows that customers who realize value within 7 days are 3–5x more likely to stick around long-term compared to those who experience delays [22].
Validating TTV Improvements and Measuring Business Impact
Reducing Time to Value (TTV) is only meaningful if you can tie those improvements to measurable business outcomes like increased revenue and customer retention. Ensuring that every tweak to your onboarding process delivers tangible results is key.
Key Metrics to Track
One of the first things to monitor is retention rates. Research shows that cutting TTV by 20% can lead to a 15% boost in first-year retention rates [23]. To validate this, compare customers who hit their value milestones quickly with those who took longer. If your milestones are well-defined, faster TTV should correlate with higher renewal rates.
Another important metric is expansion revenue. B2B software customers who achieve value within 30 days are 3x more likely to renew and 2x more likely to purchase additional products [23]. Segment your customer data by TTV speed to see if quicker onboarding translates into faster upgrades or additional purchases.
Customer satisfaction metrics like Net Promoter Score (NPS) and Customer Satisfaction Score (CSAT) can help you understand how TTV impacts user sentiment. Companies that focus on metrics like TTV tend to generate 5.7 times more revenue than those that don’t [23]. Tracking these scores alongside TTV data can highlight the emotional and financial benefits of faster value delivery.
Operational efficiency is another area to watch. A decrease in early-stage support tickets - especially "how-to" inquiries - signals that your onboarding process is working. If customers encounter fewer technical issues or blockers in the first 30 days, you’ll likely see smoother conversions and less friction overall.
By focusing on these metrics, you can validate TTV improvements and directly link them to your business goals.
Connecting TTV to Business Outcomes
Once you've validated your metrics, the next step is to connect faster TTV to tangible business results. Cohort analysis is a great way to do this. Compare weekly or monthly signup groups to see how onboarding changes impact TTV. For instance, The Room, a professional networking platform, used Userpilot’s in-app onboarding flows to encourage CV uploads. Within just 10 days, they achieved a 75% increase in new user activation [7].
For businesses with usage-based models, track how quickly customers start generating revenue after signing up. This could mean monitoring processed transactions, API calls, or other billable activities. A great example is Sked Social, which introduced an onboarding checklist focused on core value-driving actions. Customers who completed the checklist were 3x more likely to upgrade to a paid plan, tripling their conversion rate [7].
To avoid skewed data, calculate the median TTV rather than relying on averages, which can be influenced by outliers. A 2025 benchmark report of 547 SaaS companies found the median TTV to be 1 day, 12 hours, and 23 minutes [7]. Analyzing the 25th and 75th percentiles can also help you identify typical customer experiences and pinpoint areas needing attention.
Finally, measure the financial ROI of your TTV optimization. Compare the costs of onboarding tools, team hours, and development resources against the gains in retention and expansion revenue. This analysis not only proves the value of your efforts but also helps prioritize the next set of improvements to tackle.
Conclusion
Time to Value (TTV) isn't just another metric - it’s about how quickly your product delivers real, meaningful results [5][7]. Companies that excel in this area know that TTV is focused on outcomes, not just actions. Customers don’t care about completing setup steps or exploring feature tours - they want to close deals, send campaigns, and see actual results [1][4].
To improve TTV, identify your "Golden Path" - the most direct sequence of actions that leads users to success - and remove any barriers slowing them down [3]. Measuring progress? Use the median TTV instead of the average to avoid skewed data. And when refining your onboarding process, tackle the biggest bottlenecks first instead of perfecting steps that already work well [1].
Improving TTV is an ongoing effort. It requires listening to users, analyzing data, and making targeted adjustments [3][1]. Success also depends on teamwork. Aligning Product, Sales, and Customer Success teams around shared KPIs and a unified definition of success ensures everyone is working toward the same goal [2][4]. When this alignment happens, the benefits are clear: better retention, increased revenue, and happier customers.
Start tracking your TTV now. Identify where users face challenges and create the fastest path to their first win. Deliver value faster - your growth depends on it.
FAQs
::: faq
What counts as “value” for my users?
For your users, value is all about achieving the outcomes that genuinely matter to them through your SaaS product. It’s not just about learning how to use features or completing setup - it’s about hitting those meaningful milestones. Think of it as finishing a sprint successfully with a project management tool or closing an important deal using a CRM. The faster you can help users reach these results, the more likely they are to feel satisfied and stick around. :::
::: faq
What’s the best starting point for measuring TTV?
The first step in measuring Time to Value (TTV) is pinpointing what success looks like at every stage of the customer journey. Identify key milestones or events that signal customers have reached meaningful outcomes. Pay close attention to the time between sign-up or purchase and their first major result - often called the "aha" moment. To ensure accurate measurement, align these success metrics with your product's core value proposition. :::
::: faq
How do I find and fix the biggest TTV bottlenecks?
To tackle major Time to Value (TTV) bottlenecks, start by mapping out the customer journey. This helps pinpoint areas where delays or friction occur - like overly complicated onboarding processes or confusing navigation. Identifying these roadblocks is key to understanding what’s slowing users down from reaching their first meaningful milestone.
Once you’ve identified the issues, focus on streamlining the onboarding process. Simplify steps, provide guided actions, and aim to deliver quick wins early on. These changes not only reduce TTV but also help users feel accomplished faster.
Don’t stop there - keep tracking TTV after making adjustments. Regular measurement ensures your efforts are actually helping customers succeed faster and improving overall retention. :::
Related reading
- Feature Flagging Software With Experimentation Analytics (2026)
- Customer Activation Metrics: The 7 KPIs Every Product Team Should Track
- User Activation Rate: How to Find and Fix Your SaaS Aha Moment
- The SaaS Monetization Audit: Are You Leaving Revenue on the Table
- SaaS Time to Value Benchmarks 2026: Average TTV by Category
Useful tools & services
Go deeper than any blog post.
The full system behind these articles—frameworks, diagnostics, and playbooks delivered to your inbox.
No spam. Unsubscribe anytime.