The 90-Day Growth Sprint: How to Run Your First Systematic CRO Program
Three-phase 90-day plan to audit your funnel, run prioritized A/B tests, and scale winning CRO experiments for measurable revenue.
The 90-day growth sprint is a structured plan to improve your website's conversion rates systematically. Instead of relying on scattered tactics, this approach breaks down your efforts into three clear phases: auditing your funnel (Days 1–30), running high-priority tests (Days 31–60), and scaling successful experiments (Days 61–90).
Here’s why it works:
- 1% conversion rate improvement can equal a 10% traffic increase in revenue impact.
- Companies using this method run 6.45 tests/month, compared to 2.42 tests in less successful teams.
- A median 31% boost in conversion rates is achievable with this framework.
The sprint includes:
- Identifying drop-off points in your funnel.
- Prioritizing impactful hypotheses with ICE scoring.
- Running experiments and scaling what works.
::: @figure 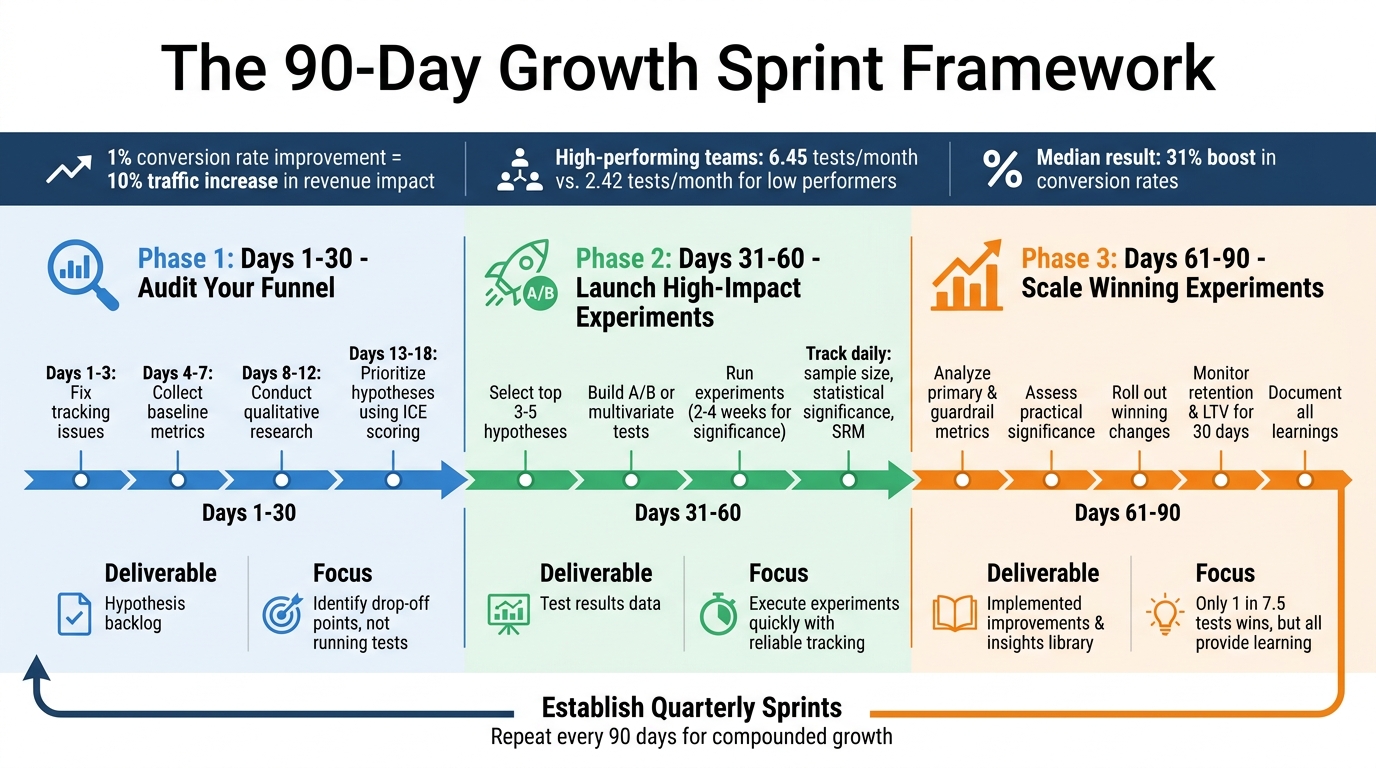 :::
:::
How to Run a Conversion Rate Optimization Program | CXL Institute Free Webinar
::: @iframe https://www.youtube.com/embed/wiiTviFOaDQ :::
sbb-itb-0499eb9
Phase 1: Days 1-30 - Audit Your Funnel and Build Your Hypothesis Backlog
The first month is all about pinpointing where users drop off in your conversion funnel. This isn't the time for running experiments; instead, you're setting the stage for meaningful tests later. By combining data analysis with user behavior insights, you'll create a prioritized list of hypotheses to guide your optimization efforts.
How to Audit Your Revenue Funnel
Start by defining the key conversion events in your funnel - such as signups, trial starts, reaching the "Aha" moment, and converting to paid customers. This ensures your team is aligned and tracking consistently across these milestones [2].
Then, review your tracking setup to confirm everything works as expected. Make sure events trigger correctly, UTM parameters remain intact throughout the user journey, and user identifiers align across systems [2]. Many CRO programs fail early due to broken or incomplete tracking.
Once your tracking is solid, establish baseline metrics. Break down your funnel stages and measure conversion rates between them while keeping track of absolute numbers to uncover the biggest drop-off points. For reference, here’s how different SaaS categories typically perform:
| SaaS Category | Visitor→Trial | Trial→Paid | Overall |
|---|---|---|---|
| Marketing | 2.1% | 22% | 0.46% |
| Sales | 1.8% | 28% | 0.50% |
| Project Management | 2.5% | 25% | 0.63% |
| Communication | 2.8% | 15% | 0.42% |
| Analytics | 1.6% | 18% | 0.29% |
Segment your funnel by acquisition source, campaign, company size, and user behavior. This will help you determine which channels perform best and where specific user groups struggle [2]. A suggested timeline might look like this:
- Days 1–3: Fix tracking issues.
- Days 4–7: Collect baseline metrics and create visualizations.
- Days 8–12: Conduct qualitative research [2].
Map Customer Friction Points
Once you’ve gathered quantitative data, shift your focus to qualitative research to understand why users drop off. Tools like session recordings, user interviews, and mystery shopping can help uncover friction points [2][3]. Platforms like UserTesting allow you to run UX audits affordably, starting at $20 per test [3].
Dive into support tickets and customer feedback to identify recurring complaints. As Stormy AI highlights:
"The problem is most likely right there on your site in your core flow where you're just not clear enough or you're not compelling enough" [3].
Apply the VJC Framework to evaluate your marketing assets. Ask yourself:
- Is it Visible (can users find it)?
- Is it Juicy (is the offer appealing)?
- Is it Clear (do users know what to do next?) [3].
Simple fixes, like clarifying pricing or improving billing forms, can lead to conversion improvements of 10–40% at specific stages [2]. These findings will fuel your prioritized hypothesis list for the next phase.
Prioritize Hypotheses Using ICE Scoring
By Days 13–18, you should have a list of potential optimizations. Each hypothesis should include:
- An observation (what you noticed).
- A proposed change.
- The behavioral mechanism (why it might work).
- A measurable outcome [4][5].
Use ICE scoring - Impact, Confidence, and Ease - to rank your hypotheses. This approach ensures you focus on ideas with the greatest potential for success [2]. The goal isn’t to test every idea but to zero in on those that could deliver the biggest improvements.
Phase 2: Days 31-60 - Design and Launch High-Impact Experiments
With your hypothesis backlog ready from Phase 1, the focus now shifts to execution. This is the stage where ideas turn into actionable tests aimed at improving conversions. The goal? Launch experiments quickly while maintaining reliable data.
Select Your High-Priority Experiments
Start by narrowing down your list to the top 3–5 hypotheses with the highest ICE scores. Validate these choices by reviewing past experiments, digging into your analytics, and ensuring each hypothesis aligns with a clear conversion goal. Whether you’re aiming to boost trial-to-paid conversions, reduce signup friction, or drive feature adoption, every experiment should have a specific focus [6].
When framing hypotheses, use a structured format: "If we [make this specific change], then [this specific outcome] will occur because [reason]." For instance, consider this example: "If we change our pricing page headline from 'Try it Out for Free' to match our PPC ad copy, then we'll see higher conversions." Optimizely used a similar approach and achieved a 39.1% increase in conversions, compared to a 12% conversion rate in their control group [6].
Document every experiment thoroughly. Include details like the objective, the hypothesis, test type (A/B or multivariate), target pages, and primary and secondary metrics. This "source of truth" document ensures clarity and alignment across your team [6].
Once priorities are set, it’s time to move into implementation.
Build and Run A/B or Multivariate Tests
With your experiments planned, the next step is building and launching them. Collaborate with your team to create test variations, using tickets to track assignments and deadlines. Prioritize high-impact elements like headlines, trial signup forms, pricing layouts, onboarding flows, and upgrade CTAs. These areas often yield the most noticeable results. Save smaller tweaks - like button colors or social proof placement - for later [6].
Don’t skip QA. Before and after launching, thoroughly test everything to catch potential bugs and ensure accurate tracking. For example, HubSpot tested slide-in CTAs on blog posts against static end-of-post CTAs. The result? Slide-in CTAs delivered a 192% higher click-through rate and generated 27% more submissions [6]. Of course, these results only matter if your tracking is flawless.
When your tests go live, notify other teams. Experiments can affect their metrics, and having extra eyes on the data can help catch issues early [6].
Track Experiment Progress
Once tests are live, set up dashboards to monitor performance. Track sample size, statistical significance, and control group metrics daily. Automate reports to keep tabs on test health and watch for Sample Ratio Mismatch (SRM) - a sign of uneven traffic splits that could invalidate your results [7].
Measure both macro-conversions (like signups or purchases) and micro-conversions (such as pages visited or time spent on-site). This helps you understand how experiments influence the entire customer journey. Tools like Mouseflow can even flag sessions with rage clicks or excessive scrolling, giving you real-time insights into underperforming tests [7].
Most tests require 2–4 weeks to reach statistical significance, depending on your traffic. Resist the temptation to declare winners too early - premature conclusions can lead to false positives. Letting tests run their full course ensures you’ll have reliable data to work with. Once completed, you’ll be ready to dive into results and scale your wins in Phase 3.
Phase 3: Days 61-90 - Analyze Results and Scale Winning Experiments
The final stretch of your 90-day plan is where all the hard work starts to pay off. Over these 30 days, you’ll dive into the data, identify which experiments delivered meaningful outcomes, and implement changes that can drive consistent revenue growth.
Analyze Experiment Outcomes
Start by examining your primary metrics - like signups, trial conversions, average order value (AOV), and refund rates. Don’t forget to check guardrail metrics to ensure your improvements are supporting overall revenue health, not just short-term gains.
Next, assess the practical significance of your results. For example, an 8% lift on a high-traffic page can lead to a massive revenue boost, making it worth the effort to implement. On the flip side, even a 20% improvement on a low-traffic page might not justify the resources needed [5].
Here’s a quick guide to help you align your analysis with decision-making:
| Reporting Element | Purpose | Decision Use |
|---|---|---|
| Overall Trend | Tracks overall business movement | Executive summary |
| Funnel Step Report | Identifies drop-off points | Hypothesis generation |
| Experiment Scoreboard | Ranks active tests | Prioritization |
| Audience Segment | Explains variation in performance | Targeted follow-up |
| Guardrail View | Flags potential "bad" wins | Rollout decision |
Keep in mind, only about 1 in 7.5 A/B tests results in a clear winner, and just 20% of those achieve 95% statistical significance [8]. But inconclusive tests aren’t failures - they’re valuable for showing what doesn’t work, saving you time and effort in the future.
Once you’ve identified the winning tests, move quickly to scale those changes for maximum impact.
Scale Revenue-Positive Changes
When you’ve pinpointed what works, it’s time to act. Use the "Propagate" step from the SHIP Framework to spread successful changes across all relevant customer touchpoints. This ensures that any boost in conversion rates is reflected in downstream metrics, such as retention and Customer Lifetime Value (LTV) [8].
As you roll out these changes, monitor retention and LTV for at least 30 days. A tweak that increases clicks but leads to higher churn could end up hurting your long-term performance [8]. Automate this process with dashboards that can immediately flag shifts in your guardrail metrics, keeping you on top of any unintended consequences.
Document and Archive Learnings
Every experiment you run contributes to a stronger Conversion Rate Optimization (CRO) framework. The real treasure isn’t just the winning variant - it’s the insights you gain about user behavior and decision-making [9].
"The primary output of a well-run experiment is not the winning variant. It's the documented insight." - Daniel Janisch, Founder, Blazeway [9]
To make the most of your experiments, create a detailed record for each one. Include the following:
- The Hypothesis: What you changed and why
- The Setup: Details like traffic split, dates, and audience
- The Results: Quantitative data from the test
- The Insight: A qualitative takeaway explaining user behavior
- The Next Action: Decide whether to implement, retest, or archive [9]
Write your insights in plain, straightforward language, as if you were explaining them to a new team member months down the line. Organize these records in a centralized library, sorted by page type, audience, and hypothesis theme. Over time, this repository will help you spot patterns - like realizing that benefit-driven headlines consistently outperform feature-focused ones for your audience [9].
It’s important to differentiate between results and insights. For example, “Variant B increased conversion by 18%” is just a result. But “Users respond better to benefit-driven headlines than feature-driven ones” is an insight. The latter adds to your team’s collective knowledge and speeds up future decision-making [9].
Tools and Team Setup for CRO Success
To run a successful CRO program, you need the right mix of tools and a well-structured team. Surprisingly, 40% of companies don’t have a dedicated resource for testing, and 63% lack any formalized approach to improving conversion rates [1]. Once your framework is in place, the next step is to ensure your team is equipped to execute effectively.
Analytics and Experimentation Platforms
Your choice of tools should align with your team’s size and budget. For smaller teams or solo marketers, affordable platforms like Kirro (around $99/month) or Crazy Egg ($99–$149/month) cover the basics [1]. Mid-sized teams often turn to VWO or Convert ($299–$399/month) for more advanced segmentation capabilities [1]. Larger enterprises typically invest in platforms like Optimizely or AB Tasty (starting at $36,000 annually), which offer robust multivariate testing and dedicated support [1].
In addition to experimentation tools, it's crucial to have resources that help uncover the reasons behind user drop-offs. Behavioral tools like Hotjar, UXtweak, and Crazy Egg provide heatmaps and session recordings to pinpoint user friction [10]. Meanwhile, performance monitoring tools such as GTmetrix (starting at $5/month) and Google PageSpeed Insights help identify site speed issues that can quietly hurt conversions [10].
A centralized knowledge management system is another must-have. Many teams scatter test results across tools like JIRA, Notion, Google Sheets, or Slides, which leads to lost insights. Using tools like GrowthLayer or simply maintaining a well-organized spreadsheet can help track experiments, avoid repeating past mistakes, and identify patterns over time [10].
Design and Development Resources
Speed is crucial in CRO. Companies that see the most improvement in conversion rates run an average of 6.45 tests per month, compared to just 2.42 tests for those experiencing declines [1]. To keep up, no-code tools can help teams bypass developer bottlenecks. Platforms like Google Tag Manager, VWO’s visual editor, or tools like Bubble and Cursor allow teams to create and launch tests in as little as 25 minutes without needing engineering support [10].
That said, having dedicated design resources is still essential. Designers should focus on creating meaningful, hypothesis-driven variations that address real user pain points rather than just making superficial changes. During Phase 2 of your sprint, prioritize high-impact elements like hero sections, calls-to-action, and form layouts [13]. Developers, on the other hand, should focus on implementing successful experiments permanently and handling complex tests that require backend changes.
Cross-Functional Team Structure
A well-rounded team ensures every stage of your 90-day sprint runs smoothly, from hypothesis creation to scaling successful experiments. Ideally, a CRO team includes eight key roles: Experimentation Lead (strategy), Marketing Manager (customer journey), Product Manager (roadmap alignment), User Researcher (qualitative insights), CRO Lead (execution), Data Scientist (statistical analysis), Software Developer (implementation), and Designer (visual solutions) [11]. However, most teams start smaller.
For smaller teams or solo marketers, one person may take on multiple roles, spending 2–4 hours per week on tasks like data analysis, test setup, and reporting [1]. The key is to assign clear ownership. Without timelines, budgets, and designated responsibilities, your strategy risks becoming a wish list instead of a plan.
Here’s how roles typically align with each sprint phase:
| Sprint Phase | Primary Role | Key Responsibilities |
|---|---|---|
| Phase 1: Audit (Days 1-30) | Data Analyst / Growth Lead | Funnel mapping, GA4 audit, session recording review, and PXL prioritization [1][13] |
| Phase 2: Launch (Days 31-60) | Designer / Developer | Hypothesis-driven design, A/B test setup, and QA across devices [13] |
| Phase 3: Scale (Days 61-90) | Growth Lead / Stakeholder | Analyzing results, calculating revenue impact, and implementing winning tests permanently [1][12] |
As your CRO program grows, consider a hybrid approach. A small "Center of Excellence" can establish standards and provide tools, while individual product or marketing teams execute their own experiments [11][12]. This structure strikes a balance, enabling scalability without creating unnecessary bottlenecks.
Measure ROI and Sustain Long-Term Momentum
Track Compounded Growth Metrics
Once you've scaled your successful experiments, measuring their impact becomes critical to refining your growth strategy. To calculate the ROI of a 90-day sprint, you can use this formula: (Monthly Traffic × (New CR% - Old CR%)) × Average Deal Value [14]. For instance, if your site attracts 50,000 visitors per month, your conversion rate improves from 2% to 3%, and your average deal value is $500, this translates to an additional $250,000 in monthly revenue.
Set up a GA4 dashboard within your first 30 days to monitor key metrics like purchase conversion rates, cart abandonment rates, and email signup rates [1]. Also, include guardrail metrics such as Average Order Value (AOV), refund rates, and lead quality to avoid "hollow wins" - those that improve conversions but harm profitability [5]. Daniel Mercer, Senior SEO Content Strategist at Analyses.info, emphasizes:
"Avoid letting teams choose success metrics post-results. That is one of the fastest ways to create false positives and erode trust in the CRO program" [5].
Compounding effects are powerful. For example, a 20% increase in acquisition combined with a 10% boost in sales leads to 32% overall growth [14]. In B2B scenarios, improving website conversion from 2% to 3% can reduce customer acquisition costs by 15-25%, making it a highly effective lever for driving pipeline growth [14]. What’s more, the improvements you make benefit every visitor, multiplying the impact of your efforts over time.
Establish Quarterly Sprints for Ongoing CRO
The first 90 days establish proof of concept, but the real challenge is maintaining momentum. To ensure long-term success, you need to turn your initial sprint into a repeatable system. High-performing organizations consistently test and refine at a much faster pace than their peers [1]. Their success isn’t random - it’s the result of deliberate and consistent effort.
Use a rolling three-month cycle to structure your CRO process:
- Month 1: Conduct audits and build a backlog of opportunities.
- Month 2: Launch and manage experiments.
- Month 3: Analyze results and scale successful initiatives [1][15].
At the end of each quarter, summarize your results, calculate the actual revenue impact, and update your test backlog. To secure stakeholder support, present a concise one-page report linking CRO goals directly to revenue - such as "Increasing conversion from 2% to 2.5% adds $25,000/month" [1].
Shift from monthly reviews to weekly check-ins to maintain alignment. Use these meetings to review KPIs, discuss experiment progress, and address any bottlenecks [15]. For pages with fewer than 1,000 monthly visitors, prioritize qualitative research. Reserve A/B testing for high-traffic pages (10,000+ visitors) to ensure your results are statistically significant [1]. By embedding CRO into your quarterly planning, you create a system that not only sustains but also amplifies your results over time.
Conclusion: Key Takeaways from Your First 90-Day Growth Sprint
A structured 90-day sprint isn't just a one-time effort - it sets the foundation for ongoing CRO success. This approach goes beyond running a few tests; it’s about creating a repeatable system that delivers long-term growth. Every improvement in conversions increases the value of future visitors, and companies with disciplined CRO programs often grow 30% faster than those relying on sporadic changes. The key? Consistency, documentation, and a clear process.
One of the biggest insights is the importance of identifying and activating key conversion drivers. In B2B SaaS, users who experience an "aha moment" are 3–5 times more likely to convert to paid plans. Early experiments should target areas like reducing the time to first value, streamlining your signup process, and refining your pricing page. These high-impact touchpoints often yield conversion gains of 10–40% with moderate effort.
Focus on speed over perfection. Running 2–3 smaller tests each month consistently outperforms a single large test every quarter. Each experiment adds to your institutional knowledge, and maintaining a detailed test log helps avoid repeated mistakes. Prioritize ruthlessly using ICE scoring - tackle changes that are impactful, confident, and easy to implement first.
Once you've completed your first sprint, plan the next one right away. Use the same three-phase structure and refine your backlog of hypotheses with insights from Sprint 1. Assemble a cross-functional team with defined roles, and set a clear SMART goal - like boosting monthly recurring revenue by 15%. Keep tracking long-term metrics, such as LTV:CAC ratio and revenue per visitor, to gauge your ROI and justify further CRO investments.
With a proven system in place, scaling becomes more achievable. Transitioning from a founder-led approach to an automated process can propel SaaS revenue from $1M to $3M ARR. Nail your first 90 days, and let the momentum from this sprint fuel your growth over the next year.
FAQs
::: faq
How do I pick the one funnel stage to focus on first?
Begin by analyzing your conversion funnel to pinpoint where users are falling off or where there's room for improvement. Look closely at critical areas like trial signups, onboarding processes, or landing pages - these are often where user behavior highlights obstacles or friction. By prioritizing the stage with the most significant impact, you can secure quick wins and set the stage for ongoing improvements. :::
::: faq
What if I don’t have enough traffic for A/B tests?
If your website doesn't generate enough traffic for A/B testing, don't worry - you can still make meaningful progress. Focus on understanding how visitors interact with your site and pinpoint areas where they drop off. Use qualitative insights, such as user feedback and behavior analysis, to uncover the reasons behind low conversions.
You can also try sequential testing, which involves testing changes over time instead of simultaneously. Another approach is to test one element at a time - whether it's a headline, button, or image. These methods allow you to make informed, data-backed decisions, even with a smaller audience, helping you fine-tune your website for better results. :::
::: faq
How do I avoid “wins” that hurt retention or revenue later?
To avoid short-term "wins" that could hurt retention or revenue down the line, prioritize long-term customer value. Approach changes carefully by starting on a small scale, testing with new users, and establishing clear criteria for when to stop. Keep a close eye on key metrics like churn rate and ARPU (average revenue per user) to catch potential problems early. If a change starts to negatively affect retention or revenue, be ready to tweak or even reverse it. :::
Related reading
- When to Offer SaaS Discounts
- Freemium vs Free Trial: Key Differences for SaaS
- Best Practices for Transitioning SaaS Growth In-House
- Localized Pricing Guide For SaaS Growth
- SaaS Pricing Experiments: How to Test Price Changes Without Killing Revenue
Useful tools & services
Go deeper than any blog post.
The full system behind these articles—frameworks, diagnostics, and playbooks delivered to your inbox.
No spam. Unsubscribe anytime.