SaaS Onboarding Benchmarks 2026 by Size & Vertical
2026 SaaS onboarding benchmarks by company size and vertical. Median activation 37.5%, AI at 54.8%, FinTech near 5%, plus optimization tactics.
Struggling with user onboarding? Here’s the deal: SaaS activation rates in 2026 average 37.5%, but success varies wildly by industry and company size. AI tools lead with a 54.8% rate, while FinTech lags at just 5%. Small businesses hit 25–35%, while enterprises perform better at 45–55%. Why does this matter? Users who activate are twice as likely to convert and three times more likely to stay loyal. A 25% activation boost can drive a 34% revenue jump in a year.
Key Takeaways:
- Top Performers: AI/ML products (54.8%), CRM tools (42.6%).
- Struggles: FinTech (5%), HR tech (8.3%) due to setup friction.
- Company Size Matters: SMBs rely on speed, while enterprises use high-touch support.
- Actionable Tips: Focus on the "aha moment", shorten onboarding steps, and use templates or sample data to reduce friction.
Quick Stats:
- Median Activation Rate: 37.5%.
- Best Industry: AI/ML at 54.8%.
- Worst Industry: FinTech at 5%.
- Revenue Impact: A 25% activation rate improvement can increase MRR by 34%.
Want to improve your activation rate? Start by identifying the key action that predicts conversion and simplify the path to first value for your users.
::: @figure 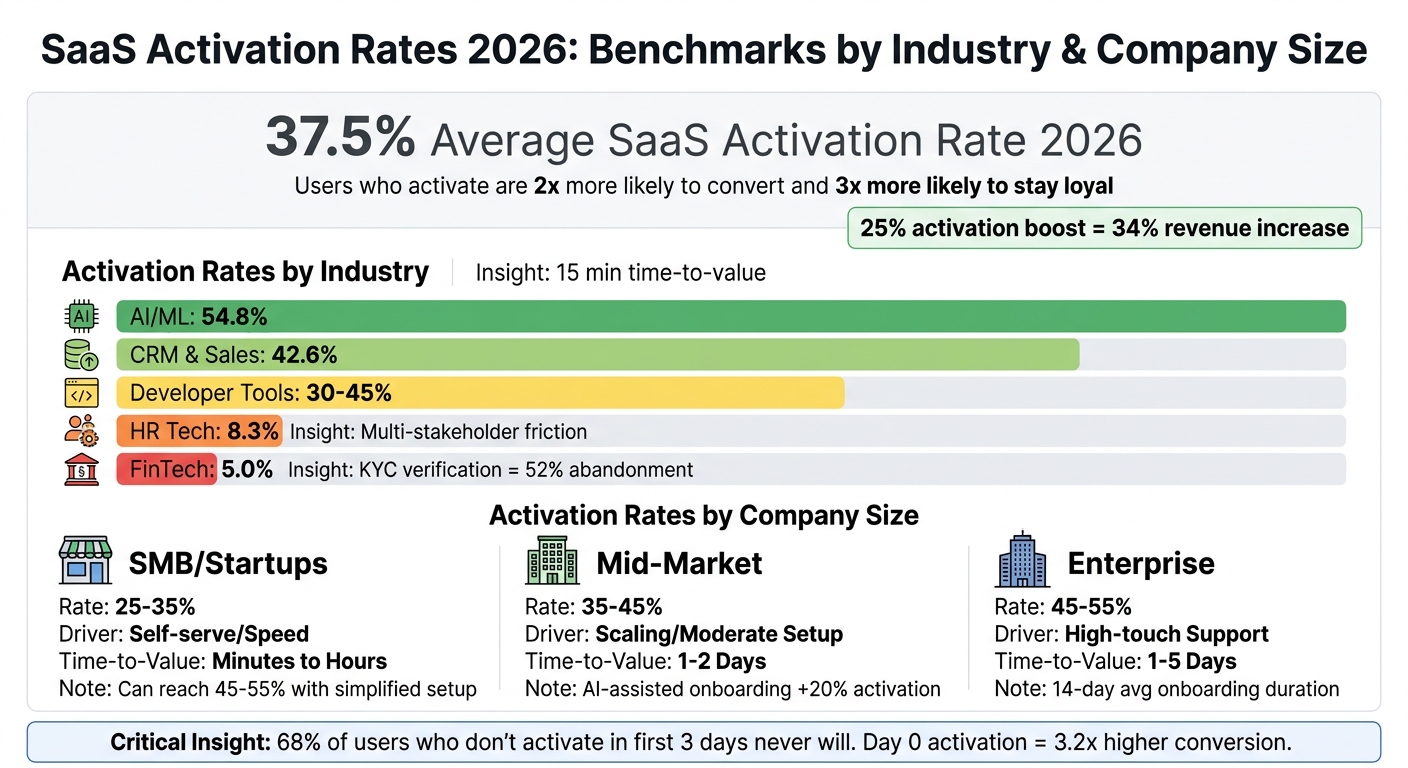 :::
:::
How to Measure & Improve User Activation | Emilia Korczyńska
::: @iframe https://www.youtube.com/embed/GsjJIFB4-TY :::
What Activation Means in SaaS Onboarding
Activation isn’t just about ticking boxes like completing a tour or filling out a profile. It’s the moment when a user truly experiences your product’s core value for the first time. This is when they realize your product can solve a key problem for them [2]. It’s the crucial step that bridges the gap between signing up and becoming a paying customer. Recognizing this difference helps separate actions that create real value from those that are just procedural.
Unlike basic setup tasks - like uploading a profile picture or verifying an email - activation is tied to actions that deliver meaningful value. Think about sending a first marketing campaign, importing contacts into a CRM, creating a project and inviting team members, connecting a data source to view reports, or inviting teammates to collaborate in a workspace. These actions go beyond simple checklists; they give users a clear sense of what your product can do for them.
"Activation is not a feeling. It's not 'users understand the product' or 'users complete onboarding.' For a CPO, activation has one definition: the specific in-product behavior that predicts trial-to-paid conversion at a statistically meaningful rate."
– Fahmi Dani, Product Designer, Jimo [2]
Why Activation Matters for SaaS Growth
Once you define activation, its importance to SaaS growth becomes crystal clear. Activation is one of the most impactful metrics in your customer funnel [8]. Users who activate are twice as likely to convert to paid plans and three times as likely to stick around. On the flip side, if a user doesn’t activate within the first three days, there’s a 68% chance they never will [8]. Day 0 activation - when users activate on the same day they sign up - is especially powerful, leading to a 3.2x higher trial-to-paid conversion rate [8].
The financial implications are huge. A 25% boost in activation rates can lead to a 34% increase in monthly recurring revenue over a year [10]. For every 10% increase in trial activation, paid conversions rise by 7.3% [8]. Plus, better activation rates shorten the time it takes to recover customer acquisition costs (CAC) and increase lifetime value (LTV). On the flip side, nearly 70% of new SaaS users abandon the product within three months if they never hit that activation moment [6].
How Activation Differs by SaaS Model
The way activation is measured and achieved can vary significantly depending on the SaaS model.
For product-led growth (PLG) companies, the focus is on “Time to First Value” (TTFV) - how quickly users can activate on their own without needing help. PLG models rely on near-instant, self-serve activation. On average, PLG companies see a median activation rate of 34.6% [5]. AI-powered products push this even further, with a median TTFV of just 15 minutes and activation rates of 54.8% [7].
Sales-led or enterprise SaaS models take a different approach. These often involve high-touch onboarding, where customer success managers guide users through more complex setups or integrations. While the activation process may take days or even weeks, this hands-on support typically leads to a higher average activation rate of 41.6% [5]. Additionally, the commitment of upfront payments or contracts often motivates users to complete the activation process.
Then there’s the reverse trial model, which flips the traditional approach. Here, users start with all features unlocked, and activation is driven by the fear of losing access as features become gated over time. This approach achieves a median activation rate of 54%, outperforming standard free trials (31%) and freemium models (22%) [8]. By allowing users to fully explore the product before committing, reverse trials often lead to better activation outcomes.
Activation Rates by Company Size
The size of a company plays a major role in how successful its onboarding process will be. Data from 2026 highlights a clear trend: larger companies tend to achieve better activation rates, thanks to their access to greater resources. This breakdown provides useful benchmarks to help tailor onboarding strategies based on company size.
The average SaaS activation rate in 2026 is 37.5% [4][5]. But when you dig deeper into the data, the differences between company sizes are striking. Startups and small businesses often face significant hurdles, while enterprise-level companies benefit from dedicated support teams that simplify complex setups.
"The 37.5% average SaaS activation rate means almost nothing for complex B2B products. Real targets vary by job complexity."
– Christophe Barre, Co-founder, Tandem [5]
Knowing where your company fits within these segments can help you set achievable goals and refine your onboarding approach. Below is a detailed look at how activation rates vary by company size.
SMB Activation Rates
Small businesses and startups typically see activation rates between 25% and 35% [4]. These companies often rely on self-serve, product-led onboarding because they lack the resources for dedicated customer success teams. Users in this segment expect quick results - sometimes within minutes or hours [5]. Any process that feels too complex or time-consuming can lead to a spike in abandonment.
However, when tools simplify the setup process, activation rates can jump to 45–55% [4]. A key factor for SMBs is providing pre-populated templates or features that speed up the time to the "aha moment." For example, Rocketbots shifted its onboarding focus to helping users send their first automated message. This change boosted their activation rate from 15% to 30% [10][2].
Mid-Market Activation Rates
Mid-market companies, often in their growth phase, generally achieve activation rates of 35% to 45% [4]. They have more resources compared to SMBs but may still lack the specialized support available to enterprises. Their typical time to value is 1 to 2 days, requiring a mix of efficient self-serve tools and occasional human assistance.
A common challenge for mid-market companies is the "Dependency Loop" [2]. This happens when admins invite team members before fully configuring the platform, leaving end-users with an incomplete experience. To address this, companies can encourage admins to complete setup tasks before inviting others.
AI-assisted onboarding is gaining traction in this segment. For instance, Aircall, a business communication platform, used an AI agent to provide contextual help for complex phone system configurations. This approach led to a 20% increase in activation for self-serve accounts [5].
As companies grow into enterprise-level organizations, their onboarding needs and activation rates evolve further.
Enterprise Activation Rates
Enterprise companies achieve activation rates of 45–55% [4]. Despite the complexity of enterprise software, high-touch onboarding - featuring dedicated support teams - helps users navigate intricate setups effectively.
The average onboarding duration for enterprises is 14 days [11], but users often experience core value within 1 to 5 days [5]. While the process is longer, those who complete it tend to stay engaged over the long term. However, enterprises face unique challenges, including a median trial-to-paid conversion rate of just 5% [5], setups involving multiple stakeholders (6 to 10 people), a 25% abandonment rate during admin setup [11], and 51% of purchased licenses going unused [6].
| Company Segment | Avg. Activation Rate | Primary Onboarding Driver | Typical Time-to-Value |
|---|---|---|---|
| SMB / Early Stage | 25–35% [4] | Self-serve / Speed | Minutes to Hours [5] |
| Mid-Market / Growth | 35–45% [4] | Scaling / Moderate Setup | 1–2 Days |
| Enterprise / Mature | 45–55% [4] | High-touch / Human Support | 1–5 Days [5] |
Activation Rates by Industry
The success of activation rates varies widely across industries. Some sectors see rates as high as 54.8%, while others struggle with just 5.0% [12]. These differences often boil down to how quickly users can experience a product's value.
Industry Leaders in Activation
AI and Machine Learning (AI/ML) products top the charts with a 54.8% activation rate [12]. These tools excel because they deliver meaningful results in as little as 15 minutes [7], with minimal setup needed. CRM and Sales tools follow at 42.6% [12], though they face challenges like data imports and workflow configuration [6]. Meanwhile, Developer tools typically achieve rates between 30% and 45% [1], but technical setup requirements can slow users down.
Struggles in Activation
On the other end of the spectrum, HR tech sees an 8.3% activation rate [12], primarily due to complex integrations and multi-step verifications. FinTech fares even worse at 5.0% [12], with KYC (Know Your Customer) verification alone causing a 52% abandonment rate [11]. Users must also navigate compliance checks and biometric setups before they can access the product's value.
"AI-native products now show 54.8% activation rates, pulling the overall SaaS average up from 30% to 37.5%."
– knowledgelib.io [7]
Interestingly, while industries like FinTech and HR tech face lower activation rates, users who complete the onboarding process often stick around longer. The effort they invest upfront creates a stronger commitment to the product [5].
| Industry Vertical | Activation Rate | Primary Challenge |
|---|---|---|
| AI & ML | 54.8% [12] | Maintaining engagement post-activation |
| CRM & Sales | 42.6% [12] | Data migration and integration friction |
| Developer Tools | 30–45% [1] | Technical setup complexity |
| HR Tech | 8.3% [12] | Multi-stakeholder buy-in and data entry |
| FinTech | 5.0% [12] | Security protocols and regulatory hurdles |
Industries Performing Above Average
AI/ML products dominate activation benchmarks because they’re designed for speed. Users can experience value almost immediately without needing to jump through hoops [6]. Similarly, sales and marketing tools perform well, with rates around 43% [7]. These tools often deliver clear "aha moments", such as automating workflows or closing a deal in a CRM.
These high-performing industries highlight an important takeaway: reducing setup barriers is critical. The SaaS median activation rate of 37.5% [7] underscores the need for streamlined onboarding processes.
Industries in the Middle Range
Some tools, like marketing automation and project management software, see activation rates between 20% and 40% [1]. These products often require users to create content or complete configurations before they can experience any real benefits.
Developer tools fall into this category as well, with activation rates ranging from 30% to 45% [1]. While technical setups - like managing API keys or configuring environments - can be time-consuming, developers tend to be patient if the tool solves their problem effectively.
Analytics and business intelligence platforms face similar hurdles, with activation rates between 15% and 30% [1]. Users often encounter blank dashboards and must integrate data sources before seeing value. Providing sample data upfront can help address this issue.
Industries with the Lowest Activation Rates
FinTech products face the steepest challenges, with activation rates as low as 5.0% [12]. Regulatory compliance is a major obstacle, delaying users from reaching their first value [6]. Even healthcare SaaS struggles, reporting an activation rate of 23.8% [12]. Compliance and privacy concerns slow down onboarding, and errors in setup carry significant risks.
For these industries, simplifying onboarding is critical. Research shows that reducing onboarding time from 10 minutes to under 5 minutes can increase activation by 40% [11]. Similarly, limiting form fields to five or fewer can prevent a 63% abandonment rate [11]. By addressing these pain points, SaaS companies can set realistic goals and improve activation outcomes across the board.
How to Benchmark and Improve Your Activation Rate
As we’ve seen, activation rates can differ greatly depending on company size and industry, but targeted improvements can drive impressive revenue growth. To understand how your activation rate stacks up against others, you’ll need more than just a single number. A proper framework should take into account your product category, company stage, and user segments. For instance, the average activation rate for B2B SaaS companies is 36% [13]. However, this number doesn’t tell the whole story - top-performing products often hit 40% or higher [1], while early-stage companies typically hover between 25% and 35% [4].
How to Build a Benchmarking Framework
To close performance gaps, you need to evaluate and fine-tune your onboarding funnel. Start by defining a specific activation behavior - something more meaningful than generic actions like "logged in" or "completed profile" [1][13]. Focus on the behavior that best predicts trial-to-paid conversion. Compare users who convert with those who churn. If the selected behavior doesn’t double the conversion rate for paying users, it’s not a valid activation event [2].
The formula for calculating activation is straightforward: (Activated Users ÷ Total Sign-ups) × 100, measured over a set timeframe [13][9]. Track this metric across different user segments, such as personas, acquisition channels, company sizes, and pricing models. This approach can highlight underperforming groups that require attention [3][9].
Use peer data to identify your industry’s median and top-quartile activation rates. Then, analyze your funnel to find the "cliff" - the point where the largest percentage of users drop off [3][2]. This is where your efforts will yield the biggest impact.
Look for signals like rage clicks, repeated errors, or frequent help-center searches [9][3]. These clues reveal not just where users abandon the process, but also why they’re struggling. Additionally, track Time-to-First-Value (TTFV) by examining both the median and the 75th/90th percentiles. A long tail in TTFV suggests that some users face significant friction [9][3].
Ways to Improve Your Onboarding Process
Once you’ve established a benchmark, focus on simplifying the path to first value. Delay optional tasks - like adding profile pictures or setting up secondary integrations - until after users have experienced their first "aha moment" [3][9]. Top-performing products typically achieve TTFV in under 5 minutes [1].
To reduce friction, provide templates or sample data to eliminate "empty state anxiety." For example, pre-populate dashboards or offer quickstart templates so users can immediately experience the product's value without extensive setup [1][3].
Keep onboarding checklists short - 3 to 5 key steps are ideal. Each additional step can reduce completion rates by 8–12% [4]. For example, a 3-step onboarding tour often sees a 70–80% completion rate, while longer tours with 10+ steps may drop to 20–30% [4]. Kontentino improved their activation rate by 10% in just a month by creating tailored onboarding flows for different user types [2].
Instead of mandatory tours, use contextual guidance. Provide tooltips or checklists only when users navigate to relevant sections of the product [1][14]. Aircall’s 2026 rollout of contextual AI guidance helped users navigate complex phone system setups, boosting advanced feature adoption by 10–20% and reducing support tickets [13].
Finally, track specific actions like Integration Connected or Project Created rather than relying on generic click data [9]. This level of detail allows for precise funnel analysis and faster iteration. For example, review your activation funnel every Monday, implement a targeted fix by Tuesday, and measure its impact by Friday [2]. Boosting your activation rate by just 25% can lead to a 34% increase in Monthly Recurring Revenue over the course of a year [6], making this one of the most effective ways to drive growth.
Conclusion
The 2026 benchmark data paints a striking picture: activation rates differ widely depending on company size and industry. On average, activation rates range from 36% to 37.5%, with standout performances from AI-native products at 54.8%, CRM tools at 42.6%, and FinTech solutions lagging behind at 5% to 15%, often due to regulatory challenges [5][6][7]. These variations highlight the importance of setting realistic benchmarks and understanding how your product compares.
The data also emphasizes that onboarding strategies must be tailored, not generic. A blanket approach can obscure critical gaps - for example, an overall activation rate of 30% might hide a 50% success rate for one user persona and a mere 15% for another [2]. Companies that excel, like Rocketbots, which saw a 300% boost in MRR by centering their onboarding around a key "aha moment", demonstrate the power of segmentation by role, company size, and use case [2].
The stakes are high. Improving activation rates by 25% can lead to a 34% jump in Monthly Recurring Revenue, while every 1% increase in activation tends to reduce churn by about 2% [6][15].
To leverage these insights, start by validating your activation event with cohort analysis. Then, design segmented onboarding paths tailored to your product category and customer profiles. Regularly review your funnel - weekly if possible - and work on minimizing time-to-first-value. With the gap between median and top-quartile performers largely driven by onboarding quality [1], there’s a clear path to improvement.
FAQs
::: faq
How do I pick the right activation event for my product?
Picking the right activation event means identifying the user action that strongly signals long-term retention and value. Start by comparing the behaviors of engaged users with those who churn. Look for milestones that reflect meaningful engagement - this is often referred to as the "Aha! moment," when users truly grasp your product's value.
To fine-tune your activation event, use tools like session recordings or funnel analysis. These can help you pinpoint the actions that align closely with your product’s core value and resonate with your target audience. :::
::: faq
What activation rate should I target for my company size and industry?
For SaaS businesses, activation rates generally fall between 15% and 45%, though this can vary depending on the industry and company size. The median range is typically 20% to 35%, while top-performing companies aim for 40% or higher.
These benchmarks serve as a useful guide to assess and refine your onboarding process, tailored to your specific business size and sector. :::
::: faq
How can I cut time-to-first-value without removing key setup steps?
To speed up time-to-first-value (TTFV) without cutting corners on essential setup steps, focus on streamlining the onboarding process. Personalize the experience, minimize friction, and guide users toward their "aha moment." Simplify critical steps by leveraging in-app tools like tooltips and checklists, and customize workflows to align with specific user goals. Keep an eye on activation metrics to pinpoint and resolve any bottlenecks. This approach ensures users experience value faster while completing all necessary steps. :::
Related reading
- Feature Flagging Software With Experimentation Analytics (2026)
- Time to Value (TTV): How the Best SaaS Companies Measure and Reduce It
- Customer Activation Metrics: The 7 KPIs Every Product Team Should Track
- User Activation Rate: How to Find and Fix Your SaaS Aha Moment
- The SaaS Monetization Audit: Are You Leaving Revenue on the Table
Useful tools & services
Go deeper than any blog post.
The full system behind these articles—frameworks, diagnostics, and playbooks delivered to your inbox.
No spam. Unsubscribe anytime.