The Retention Curve Nobody Talks About: Why Month 3 Matters More Than Month 1
Month 3, not Month 1, decides if users form habits or churn—use activation, cohort analysis, and proactive outreach to cut mid-term loss.
Most SaaS companies focus too much on onboarding during Month 1, but the real churn problem happens later. By Month 3, 70% of new users are gone. The reason? They haven’t built habits or seen consistent value from the product. This period, often called the "Month 2 Cliff", is when users decide if they’ll stay or leave.
Here’s why Month 3 is critical and how to fix churn:
- Retention impacts revenue more than acquisition. A 1% churn reduction boosts lifetime value by 7%.
- Early engagement is key. If users don’t engage within 72 hours, churn risk jumps to 90%.
- Habits drive retention. Products need to become part of a user’s routine by Month 3, or they’ll lose interest.
- Proactive outreach works. Reach out before users disengage, and offer options like pausing subscriptions instead of canceling.
Companies that prioritize retention after onboarding see real growth. Month 3 isn’t just a milestone - it’s the point where habits form and long-term loyalty begins.
How to Tackle Your Retention Problem | SaaS Metrics School | Retention
::: @iframe https://www.youtube.com/embed/jfq2ZM-DGc4 :::
The Month 3 Drop-Off: What the Data Shows
::: @figure 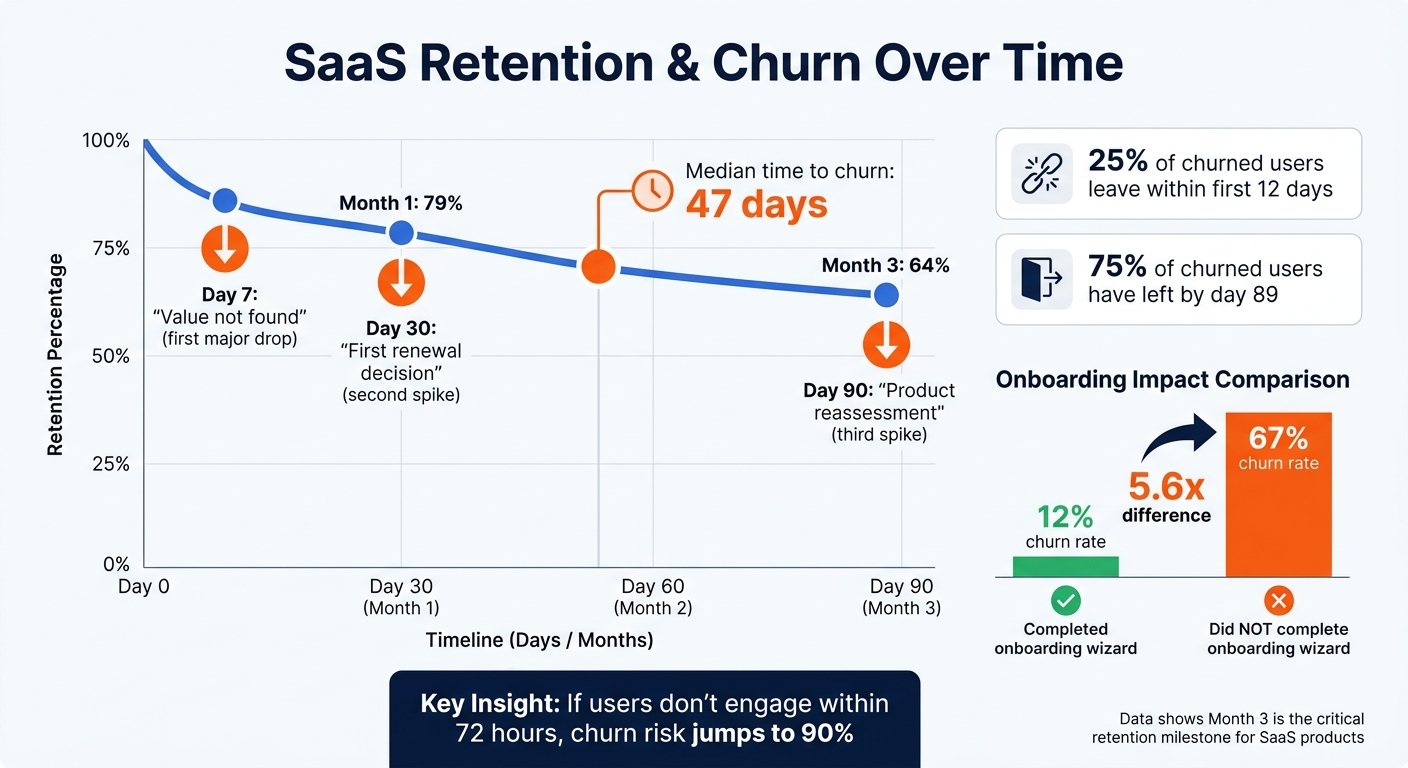 :::
:::
Retention trends for most SaaS products paint a familiar but challenging picture. While Month 1 retention rates hover around 79%, by Month 3, they dip significantly to about 64%. The median time before users churn is just 47 days [4]. Digging deeper, 25% of churned users leave within the first 12 days, and a staggering 75% have churned by day 89 [4]. Key churn spikes occur on Day 7 (value not found), Day 30 (often tied to the first renewal decision), and Day 90 (when users reassess the product after three months) [5]. While onboarding gets a lot of attention, keeping users engaged beyond those initial days is where the real challenge lies. This data sheds light on how early enthusiasm fades and what factors lead users to disengage.
What Happens After Users Get Started
These numbers make one thing clear: early wins, while important, don't guarantee lasting engagement. That initial "aha moment" - when users see value in your product - is just the beginning. Without building habits that integrate the product into their routines, users gradually lose interest. The decline in engagement often reflects a failure to make the product an indispensable part of their daily lives. For instance, RetentionFlow’s analysis showed that users who completed their onboarding wizard had a much lower churn rate of 12%, compared to a staggering 67% for those who didn’t [4]. Even among those who successfully onboard, engagement tends to drop sharply after the first few weeks, as the initial excitement fades and the product struggles to become part of their everyday workflow.
Why Users Leave at Month 3
The churn at Month 3 isn’t usually about pricing or missing features - it’s about belief. As Thomas Lalas, author of Retention Economics, puts it:
Price isn't the enemy – doubt is. If buyers don't believe your product will work for them... they will churn long before price, convenience, or timing ever enter the conversation. [3]
This insight highlights the importance of building trust and reinforcing the value of your product consistently, well beyond the onboarding phase.
How to Reduce Month 3 Churn
The period between Day 30 and Day 90 is when churn tends to spike. During this time, the initial enthusiasm users feel often fades, and your product can lose its perceived value [1]. The answer isn’t about piling on features or adjusting pricing - it’s about turning occasional use into a consistent, daily routine before users decide to cancel.
Creating Habits That Stick
Activation happens when users experience genuine value - not just when they log in. Identify the key moment when users feel the benefit of your product, whether it’s completing a workout, creating a report, or inviting a teammate. Then, streamline their path to that moment by removing unnecessary steps [1].
Retention experts suggest using "pulls" to build habits. These pulls can take different forms:
- Social pulls: Notifications like "Your teammate left 3 comments."
- Time pulls: Reminders such as "It’s campaign review Monday."
- Outcome pulls: Messages highlighting benefits, like "You saved 4 hours this week" [2].
These strategies aren’t just clever tricks - they’re effective ways to keep users engaged by consistently reinforcing the value they signed up for.
There are plenty of real-world examples to back this up. ConvertKit cut its churn rate by nearly 15% in just one month by sending personalized welcome videos to new subscribers - over 50 videos per day. Meanwhile, HubSpot’s Sidekick product improved Week 12 retention from 15% to 25% by enhancing its onboarding process, which also boosted Week 1 retention by 15% [8]. Even small gains in early retention can snowball into big improvements by Month 3.
While habit-building is important, proactive outreach can further strengthen engagement.
Reaching Out Before Users Disappear
Don’t wait for users to disengage - reach out first. If a user hasn’t hit their key activation point by Day 5, send a helpful message instead of a sales pitch [1]. The chances of reactivating them drop significantly as time goes on, especially after the first three weeks. To catch users before they disengage completely, set clear risk thresholds, like 14 days without a core action or a 50% drop in weekly activity over two weeks [2].
Take Originality.ai as an example. Between January and March 2026, they replaced their one-click "Cancel" button with a dynamic flow offering a "Pause" option for users citing "Project finished" as their reason for canceling. This change reduced their churn rate from 33% to 26% in just eight weeks [9]. Research shows that 44% of users who plan to cancel would opt to pause their subscription if given the choice [8].
Another effective tactic is to reframe billing reminders. Instead of saying, "Your card will be charged in 3 days", use something like, "Your next [benefit] ships in 3 days" [3]. This subtle shift emphasizes the value users are receiving rather than focusing on the payment.
Beyond direct outreach, embedding your product into the user’s daily workflow can make it harder for them to leave.
Using Integrations to Keep Users Locked In
Integrations are one of the strongest retention tools because they weave your product into the user’s existing workflow, making it harder to switch. When users connect your tool to their CRM, Slack, or calendar, leaving means they’d have to rebuild those connections from scratch.
In 2021, Kaleido (later acquired by Canva) reduced involuntary churn by 38% by offering flexible subscription options through Paddle’s API. Customers could pause or delay payments up to twice a year. They also localized their product into over 20 currencies to address payment failures [8].
For B2B products, multi-threading accounts is another key strategy. If your main point of contact leaves the company, having secondary users or an executive contact already engaged (ideally within the first 30 days) can help maintain the account [2]. Features that encourage collaboration - like team invites, shared dashboards, or community connections - create social accountability, which supports long-term retention.
Tracking Month 3 Retention: Metrics That Work
You can’t fix what you don’t measure. Many teams rely on overall churn rates, but these often hide critical details. For instance, a 5% churn rate might mean organic users are thriving while your paid search users are dropping off at an alarming rate [11]. The key to addressing Month 3 retention issues lies in tracking cohorts individually and focusing on meaningful actions.
Using Cohort Analysis to Find Drop-Off Patterns
Cohort analysis groups users based on when they signed up and tracks their behavior over time. By comparing cohorts - say, those who joined in January versus March - you can uncover how changes in your product, onboarding process, or pricing impact retention [10][13].
To get started, create a retention matrix where rows represent cohorts and columns show months since acquisition (Month 0 starts at 100%). For subscription businesses, use the first-payment date instead of the signup date. This approach filters out trial users who never convert, providing cleaner and more actionable data [14].
Take RetentionFlow as an example: In 2025, they discovered that users who skipped their onboarding wizard churned at a rate of 67% within 30 days, compared to just 12% for those who completed it. Sarah Martinez, their VP of Product, led a redesign that reduced the wizard from 12 steps to 4, boosting completion rates from 23% to 67%. The results? The April 2025 cohort achieved an 81% retention rate by Month 3, up from 64% in January, while monthly churn dropped from 7.2% to 3.4% [4].
"We knew churn was high. We didn't know why. Cohort analysis revealed the onboarding wizard was our problem - users who didn't finish it churned at 5.6x the rate of those who did." - Sarah Martinez, VP Product, RetentionFlow [4]
When analyzing cohorts, look at rows to follow a single cohort’s lifecycle and columns to see if Month 3 retention improves over time. If retention for March is worse than January, something isn’t working [13][15]. Segmenting by acquisition channel also helps. For instance, if users from Google Ads churn faster than referrals, it’s a clear signal to reallocate your budget [14].
The shape of your retention curve is just as important as the numbers. A sharp drop in the first two months points to onboarding or activation issues, while a steady decline through Month 3 suggests users aren’t finding ongoing value [14]. Ideally, your curve should flatten by Month 3, signaling a core group of users who see long-term value [10][15].
| Segment | Month 1 Retention | Month 3 Retention | Month 6 Retention |
|---|---|---|---|
| B2B SaaS (SMB) | 65-75% | 40-55% | 30-45% |
| B2B SaaS (Enterprise) | 80-90% | 65-75% | 55-70% |
| B2C SaaS / Consumer | 25-40% | 12-25% | 8-18% |
| Top-quartile B2B SaaS | 85%+ | 70%+ | 60%+ |
Source: Amplitude/ProfitWell/Mixpanel Benchmarks via RetentionCheck [10]
"If you are below 30% at month 3 for any cohort, that is a strong signal of an activation or value delivery problem." - RetentionCheck [10]
With these insights, you can pinpoint exactly where to focus your improvements.
Calculating Month-Over-Month Retention Rates
Month 3 is a critical point, so it’s essential to define "active" based on a core action that reflects real value - not just logins. Login metrics often overstate engagement by 20-40% because users might sign in, browse briefly, and leave without doing anything meaningful [10]. For a reporting tool, "active" could mean running a report, while for a project management app, it might involve creating a task or inviting a teammate. This action-based retention gives a clearer picture of user stickiness than vanity metrics.
Use bounded retention to measure activity within a specific period, like Month 3. Rolling retention, which counts users as active if they’ve performed the core action at any point after Month 3, can obscure issues with regular usage [10]. For subscription models, bounded retention offers a more accurate view.
Track both customer retention (number of users) and revenue retention (Net Revenue Retention or NRR) at Month 3. While customer retention measures product engagement, revenue retention highlights the financial impact [13]. In 2025, the median NRR for SaaS was 101%, and companies with NRR above 100% grew 48% year-over-year - more than twice the rate of those below 100% [14].
Survival curves can also help you understand churn velocity, showing whether users drop off quickly or gradually [12]. Calculating the median time to churn - like Day 47, for instance - can guide targeted interventions before users leave [4].
"The shape is the signal. A number without context offers little insight." - Fiscallion [14]
Getting Your Team to Care About Month 3
Once you've identified the problem and set up the dashboards, the next step is rallying your team around Month 3 retention. Many organizations celebrate signups and new deals but tend to ignore the users who vanish by Month 3. Fixing this isn't just about tracking better metrics - it's about redefining success and aligning incentives across every department.
Shifting Focus from Acquisition to Retention
Metrics shape behavior. If sales teams are measured only by total contract value (TCV) and marketing celebrates marketing qualified leads (MQLs), no one feels responsible for what happens at Month 3. As Tim Thyne, Head of Customer Development at Help Scout, explains:
It behooves companies to shift the focus from what employees do ('I market,' 'I sell,' 'I support') to what benefits they provide to the customer, which starts by tracking people's performance differently. [8]
To drive better outcomes, replace vanity metrics with ones that predict long-term retention. For example, instead of tracking login rates, focus on the Weekly Active Ratio (WAU/MAU), which shows whether users are forming habits instead of just checking in [1][2]. For revenue teams, prioritize trial-to-paid conversion rates and 30-day repurchase rates over "new trial starts" [16][3].
| Department | Acquisition Focus | Retention Focus |
|---|---|---|
| Sales | Total Contract Value (TCV) / Signups | Commission tied to Month 3 survival |
| Marketing | Marketing Qualified Leads (MQLs) | Sales Qualified Leads (SQLs) / Trial-to-Paid Conversion |
| Product | Features Shipped / Story Points | Time to Core Value / Activation Rate |
| Customer Success | Ticket Resolution Time | Net Promoter Score (NPS) / Net Revenue Retention (NRR) |
Product teams, for instance, should focus on "Time to Core Value" - how quickly users perform key actions that indicate they'll stick around - rather than counting features shipped [8][16]. Marketing teams need to shift their focus from lead volume to lead quality, ensuring signups are more likely to stay engaged past Month 3 [8]. The goal is to make retention a shared priority across every department.
Aligning Compensation with Retention Goals
Metrics alone won't drive change - incentives matter too. If sales reps earn their full commission as soon as a contract is signed, they have little reason to care if customers drop off. David Cancel, Founder and CEO of Drift, emphasizes the importance of designing internal metrics that encourage retention across all departments [8].
For sales teams, consider tying part of their commission to whether customers remain active for 90 days. If customers churn before Month 3, reduce the payout. Similarly, limiting the number of prospects per rep - by industry or geography - can help prioritize quality over quantity [8].
Marketing bonuses should reward improvements in SQL conversion rates and the percentage of trials that convert into loyal customers who stick around beyond Month 3 [8]. Product managers, on the other hand, should focus on activation rates - whether users reach that critical "aha moment" - instead of just delivering features [8][16].
The data is clear: focusing on retention pays off. Acquiring a new customer costs 6 to 7 times more than keeping an existing one, and even a 5% boost in retention can increase revenue by 25% to 95% [7]. When every team - sales, marketing, product, and customer success - takes ownership of Month 3 retention, the results follow.
Conclusion
Month 1 sparks interest; Month 3 reveals staying power. Early onboarding metrics might show how well your marketing efforts paid off, but Month 3 retention tells a deeper story: has your product become essential, or is it just another fleeting curiosity? Month 3 is more than a checkpoint - it's the moment when user habits solidify or fade. As Ronald Davenport, Lifecycle Architect, explains:
The customers who survive month three are the ones who experience real value before they have time to forget why they subscribed. That's not chance - it's the result of deliberate design. [1]
Reducing churn from 8% to 3% isn't just a small improvement - it can increase a customer's lifetime value by 166% [6]. This isn't about incremental gains; it's about ensuring long-term growth and avoiding the "leaky bucket" problem, where new signups barely offset ongoing losses.
Dig into your retention curve to find where users drop off. Cohort analysis can help you identify when and why users leave. Is it tied to poor activation, a failure to build habits, or something as simple as missed payments? For example, RetentionFlow discovered through cohort analysis that users who skipped their onboarding wizard were far more likely to churn - a discovery that led to a meaningful boost in retained annual revenue [4].
Shift your focus from acquisition to mid-term engagement. Use the data you’ve gathered to design targeted interventions. For instance, set up automated outreach for users who haven’t hit key milestones by day 5. Develop health scores to flag at-risk users before they disappear. And align team goals with retention metrics, such as 90-day retention rates, instead of just signups. Companies excelling in retention don’t necessarily have better products - they excel at building habits that keep customers engaged [1].
Month 3 defines the future of your SaaS business. It’s not just another milestone; it’s the critical point that separates businesses with sustainable growth from those endlessly chasing new customers to make up for losses. Nail your Month 3 retention strategy, and you’ll make growth far simpler.
FAQs
::: faq
What should count as an “active” user in Month 3?
An “active” user in Month 3 is someone who is consistently interacting with the product and has clearly recognized its value by this point. This might involve actions such as logging in frequently, utilizing essential features, or completing critical tasks that show they are engaged and sticking around. Pinpointing these behaviors is key to supporting lasting user retention. :::
::: faq
How can I spot users likely to churn before Day 90?
To reduce churn, it's crucial to identify users who might leave before Day 90 by analyzing their early engagement patterns. Pay close attention to these key signals:
-
Activation in the First Week: Did the user complete critical onboarding steps or engage with the product meaningfully during their first few days? Early activation is often a strong indicator of long-term engagement.
-
Login Frequency: How often are users logging in? A drop in login frequency, especially after the initial week, could signal declining interest.
-
Feature Usage: Are users exploring and using the core features of your product? If not, they might not see the value, making them more likely to churn.
Most churn tends to occur between Day 30 and Day 90, as the initial enthusiasm for the product starts to wane. By monitoring these behaviors early, you can take proactive steps to re-engage users and improve retention rates. :::
::: faq
What are the fastest ways to build habits between Day 30 and Day 90?
To solidify habits between Day 30 and Day 90, concentrate on behavioral triggers and strategies that keep users actively engaged. Tailor personalized reminders to emphasize the product's benefits and establish clear activation milestones so users can quickly experience its core value. Implementing a structured 30/60/90-day plan that includes small, achievable goals and early indicators of potential churn can help transform engagement into a regular habit while ensuring steady interaction with your product. :::
Related reading
- How to Use Discounts Without Hurting Revenue
- Top Upselling Techniques for SaaS Success
- 5 SaaS Discounting Rules for Retention
- How Proactive Support Reduces SaaS Churn
- How to Measure and Improve Time-to-Value
Useful tools & services
Go deeper than any blog post.
The full system behind these articles—frameworks, diagnostics, and playbooks delivered to your inbox.
No spam. Unsubscribe anytime.