The CRO Metrics That Actually Predict Revenue Growth (Not Vanity Dashboards)
Focus on NNARR, CAC payback, and NRR to measure sustainable SaaS revenue growth and avoid vanity metrics.
Vanity metrics - like pageviews or follower counts - don’t predict revenue growth. Instead, focus on actionable metrics that directly influence decisions and impact revenue. Here are three key metrics SaaS companies should prioritize:
- Net New Annual Recurring Revenue (NNARR): Tracks sustainable growth by measuring the net change in ARR, factoring in new revenue, expansions, churn, and downgrades.
- Customer Acquisition Cost (CAC) Payback Period: Measures how long it takes to recover acquisition costs. A shorter payback period means better cash flow.
- Net Revenue Retention (NRR): Reflects customer retention and expansion, with top performers achieving NRR above 120%.
These metrics help identify revenue trends, improve decision-making, and ensure long-term growth. Ditch vanity stats and follow a complete guide to conversion rate optimization to focus on what truly matters for your business’s health.
5 Metrics Every SaaS Leader Must Master | SaaS Metrics School
::: @iframe https://www.youtube.com/embed/aV17nLdIakE :::
sbb-itb-0499eb9
The CRO Metrics That Actually Predict Revenue
::: @figure 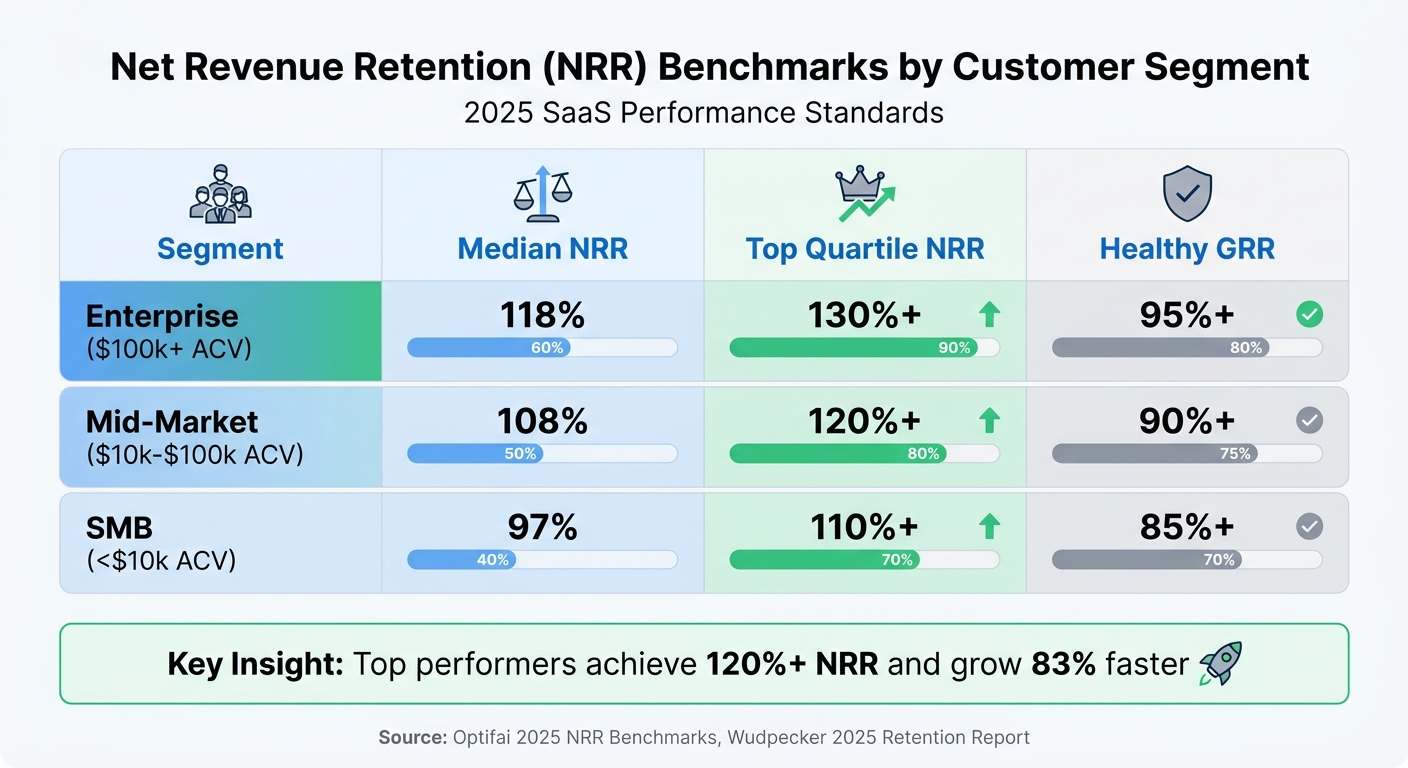 :::
:::
When it comes to SaaS, some metrics do more than just look good on a dashboard - they serve as early indicators of your revenue's trajectory. These numbers can highlight the health of your revenue model long before it reflects in your bank account. Let’s break down three key metrics that hold the most weight.
Net New Annual Recurring Revenue (NNARR)
NNARR stands out because it doesn’t just focus on new customers - it captures the broader picture, including your existing customer base. This metric measures the net change in your annual recurring revenue (ARR) over a specific period. The formula? Add the annualized value of new MRR and expansion MRR, then subtract contraction MRR and churned MRR.
Why does this matter? NNARR shows whether your growth is sustainable or just a temporary boost from new customer acquisition. For example, a SaaS company growing 15% month-over-month can be valued 3–5x higher than one growing at 5%, even if both have the same revenue [3]. That’s because NNARR highlights the difference between true growth and what’s essentially a leaky bucket.
Here’s the reality check: If you’re adding $50,000 in new MRR but losing $40,000 to churn and downgrades, your net new ARR is only $10,000. While your sales team might celebrate the $50,000, NNARR forces you to confront the real story.
Customer Acquisition Cost (CAC) Payback Period
Growth isn’t just about adding customers - it’s also about managing costs. The CAC Payback Period measures how long it takes to recoup what you spent acquiring a customer. Think of it as a cash-flow health check. The shorter your payback period, the faster you can reinvest in growth.
To calculate this accurately, factor in everything: sales and marketing salaries, CRM tools, agency fees, and even overhead costs [3]. With customer acquisition costs rising 14% in 2024, efficiency is more critical than ever for 2025 and beyond [4].
Aiming for a payback period under 12 months is a solid benchmark [4][6]. If it’s closer to 18 months, you’re likely burning through cash that could otherwise fuel growth. And if your monthly churn exceeds 5%, every dollar spent on acquisition becomes less effective [6].
One tip: Calculate CAC by cohort, not by month. For example, marketing dollars spent in January may not convert to customers until March. Aligning your spend with actual conversion months provides a clearer picture of your costs [3].
Net Revenue Retention (NRR)
NRR measures how much revenue you’re retaining from existing customers over time, factoring in upgrades, downgrades, and churn - but not new customer revenue. An NRR above 100% means your expansion revenue outweighs what you’re losing, which is a strong indicator of healthy growth.
"NRR above 115% is the single strongest predictor of a Series B-to-C valuation uplift in 2026 B2B SaaS." - Peter Vogel, Founder, peppereffect [5]
The median NRR for private SaaS companies in 2025 is 101%, with top-quartile performers hitting 120% or more [5]. Companies with higher NRR grow 83% faster than their peers [5]. For public SaaS companies, NRR above 120% translates to ARR multiples of 13-15x, compared to just 6-8x for lower retention rates [7].
Take Snowflake, for example. Its NRR of 165-170% in 2026 is driven by usage-based pricing that scales as customers’ data needs grow [5]. Monday.com, on the other hand, achieves 140-145% NRR through seat-based expansion and tier upgrades [5]. Even HubSpot, targeting the mid-market, maintains 105-110% NRR by offering "hub" tier upgrades and contact-based pricing [5].
Segmentation is key. A blended NRR might look good on paper, but it can hide underlying issues. For instance, enterprise customers might show an NRR of 130%, while SMBs struggle to hit 90% [5][7]. Breaking it down by segment ensures you’re not missing red flags.
| Segment | Median NRR | Top Quartile NRR | Healthy GRR |
|---|---|---|---|
| Enterprise ($100k+ ACV) | 118% | 130%+ | 95%+ |
| Mid-Market ($10k-$100k ACV) | 108% | 120%+ | 90%+ |
| SMB (<$10k ACV) | 97% | 110%+ | 85%+ |
Source: Optifai 2025 NRR Benchmarks, Wudpecker 2025 Retention Report [5]
These metrics - NNARR, CAC Payback Period, and NRR - go beyond surface-level numbers. They provide a window into the sustainability and efficiency of your revenue model, helping you make smarter decisions for long-term growth.
How to Track and Analyze These Metrics
Tracking and analyzing actionable metrics is the key to transforming raw data into decisions that drive revenue. To do this effectively, you’ll need integrated systems like CRMs, billing platforms, and analytics tools to uncover genuine revenue trends.
Set Up Attribution in Your CRM and Analytics
To connect marketing efforts to actual revenue, set up attribution systems in your CRM (like HubSpot or Salesforce) and analytics platforms. For example, mapping Google Click IDs (GCLIDs) to deals in your CRM allows you to see which campaigns contribute to recurring revenue, rather than focusing on vanity metrics like sign-ups [8].
Real-world examples back this up. TestGorilla shortened its CAC payback period to just 80 days by using multi-touch revenue tracking. This approach helped them identify and invest in channels undervalued by last-click attribution models [14].
"Revenue attribution transforms marketing from a cost center into a measurable growth driver by connecting every campaign to actual business outcomes." - Vincent Gaemers, Spectacle [9]
To set this up, ensure your tech stack includes these tools:
- A CRM for tracking deals and customer data
- A billing platform like Stripe or Zuora to monitor cash flow
- Subscription analytics tools to automate cohort analysis [8]
Reconcile your CRM and billing data monthly. If discrepancies exceed 5%, investigate immediately. Many SaaS companies mistakenly include one-time fees or variable charges in their ARR calculations, which inflates growth metrics. To keep your numbers clean, exclude setup fees, consulting revenue, and one-time payments from metrics like NNARR and NRR [8].
For B2B SaaS companies, extend your attribution windows to at least 90 days. Sales cycles often average 192 days and involve multiple touchpoints - about 62 on average. Extending attribution windows from 30 to 90 days can reveal up to 2.5× more pipeline value for channels like Google Ads [14][15].
With accurate revenue attribution in place, you can begin to break down your data by customer segment to find out where your growth opportunities really lie.
Break Down Metrics by Customer Segment
Blended metrics often hide critical insights. For instance, while your overall NRR might look strong, it could be masking high churn among SMB customers, with enterprise accounts propping up the average. Breaking metrics like NNARR, CAC Payback Period, and NRR into customer segments helps pinpoint which groups are driving growth.
Segment your data by:
Use tools like Segment or Zapier to integrate your CRM, billing, and analytics systems. This allows you to capture customer attributes during onboarding and link them to transaction data [11][12].
Calculate CAC, LTV, and NRR separately for each segment. Even small improvements in segmentation can have a big impact - a 1% improvement in segmentation can lead to a 1.6% boost in overall revenue. Companies that tailor pricing based on segment analysis often see profit margins rise by 3–8% [11]. The 80/20 rule frequently applies here: 20% of customers typically generate 80% of revenue. Tracking Revenue Per User (RPU) by source can help identify channels that bring in high-quality, long-term customers instead of just high volumes [13].
For B2B SaaS businesses, about 40% of new ARR comes from existing customers via renewals and upsells. Make sure your attribution system credits marketing efforts for these expansions [8][9].
Finally, establish a regular review process. Analyze segment revenue trends monthly and conduct deeper profitability reviews quarterly. Companies that consistently monitor segment performance tend to outperform competitors by 25% in revenue growth [11].
CRO Mistakes That Kill Revenue Growth
Even with access to actionable metrics, SaaS companies often sabotage their growth by focusing on surface-level numbers and overlooking retention. This creates a misleading sense of progress while revenue potential quietly slips away. To achieve genuine growth, it’s essential to focus on meaningful metrics and steer clear of common mistakes that undermine their effectiveness.
Chasing Metrics That Don't Affect Revenue
Tracking metrics like website traffic, social media followers, or registered users might feel rewarding, but these numbers often have little connection to actual business outcomes. As Udit aptly puts it:
"Vanity metrics are the startup equivalent of a fitness tracker that tells you how many steps you walked while you are gaining weight - technically accurate, emotionally reassuring, and fundamentally misleading" [1].
The issue becomes even more damaging when teams prioritize quantity over quality. For example, a product might boast over 90% onboarding completion, yet audits reveal that most users leave by day two without ever experiencing the product’s core value [16]. Similarly, marketing campaigns with the highest impressions often deliver the lowest conversion rates, attracting casual browsers instead of serious buyers [2].
Here’s a stark example: Adding $5,000 in new MRR (Monthly Recurring Revenue) each month with a 10% churn rate caps your revenue at $50,000. This formula (Maximum MRR = New MRR added per month / Churn Rate) highlights how chasing vanity metrics can mask the reality of stagnant revenue growth [2].
Just as vanity metrics mislead, ignoring retention metrics can be equally damaging.
Ignoring Retention Metrics Like NRR
While chasing quantity skews your strategy, neglecting retention metrics paints an incomplete picture of sustainable growth. High acquisition numbers can easily hide rapid customer losses. For instance, a company with a 5–6% monthly churn rate loses customers faster than they can bring them in, making long-term growth mathematically impossible [17]. To put it in perspective, a 5% monthly churn wipes out 46% of customers annually, while even a 2% churn results in a 22% loss [1].
Unlike MRR, which reflects past performance, NRR (Net Revenue Retention) provides insight into future potential by measuring both customer retention and expansion. As Seeto explains:
"MRR is an output, not a signal. It tells you what already happened. It does not tell you why it happened or whether it will keep happening" [17].
Without tracking NRR, you might acquire 100 new customers but lose 80 existing ones - making it look like acquisition is thriving while your MRR quietly declines [18].
Early-stage companies often undervalue expansion revenue because the dollar amounts seem small. However, the growth rate of expansion revenue is a critical indicator of future success. The median NRR for companies with healthy growth is around 105% [17], while standout companies like Snowflake hit 158% at IPO [1]. Monitoring NRR from the beginning helps you identify which customers are expanding and why, even if the data is initially volatile [17].
These mistakes - focusing on vanity metrics and overlooking retention - directly hinder revenue growth by obscuring the metrics that truly reflect sustainable performance.
Conclusion
The Metrics That Matter for SaaS Revenue
When it comes to scaling SaaS revenue, the metrics you prioritize can make or break your growth. NNARR measures your new ARR, CAC Payback shows how quickly you recover your acquisition costs, and NRR reveals whether your customers are sticking around or leaving. Top-performing SaaS companies often achieve NRR above 120% - a benchmark for strong customer retention and expansion [19]. Together, these metrics give you a clear view of your revenue health.
However, raising your Annual Contract Value (ACV) often comes with higher CAC and more intense sales efforts [2]. Balancing these trade-offs is key. Instead of chasing flashy numbers, focus on metrics that align with your long-term goals and actually drive sustainable growth.
Colby Flood, Founder of Brighter Click, offers a sharp reminder:
"If you and your team cannot look at your metrics right now and tell me exactly when your revenue will stop growing, your dashboard is decoration. It is not a tool. It is a screensaver." [2]
What to Do Next
To ensure your metrics are actionable, start by auditing your dashboard. If a metric doesn’t lead to an immediate decision, it’s probably just a vanity stat [1][10]. Remove anything that doesn’t directly impact your strategy.
Next, calculate your revenue ceiling using this formula: New MRR added per month ÷ churn rate [2]. If the result falls short of your revenue goals, focus on reducing churn instead of just acquiring new customers.
Assign clear accountability for each metric using a KPI Ownership Matrix, making sure every number has a person responsible for taking action [19]. Set up automated CRM alerts for critical thresholds - like when pipeline coverage drops below 3x or when NRR starts to decline [19]. These proactive measures can help shift your team’s focus from simply reporting numbers to actively managing revenue growth.
FAQs
::: faq
How do I calculate NNARR from my MRR data?
To figure out NNARR (Net New Annual Recurring Revenue), start by calculating your Net New MRR:
Net New MRR = New MRR + Expansion MRR - Churned MRR - Contraction MRR
Once you have that number, multiply it by 12:
NNARR = Net New MRR × 12
This calculation shows the net change in ARR during the period, highlighting whether your revenue is growing or shrinking. :::
::: faq
What’s a good CAC payback period for my sales cycle?
A good CAC payback period typically falls between 12 to 15 months. This timeframe indicates an efficient path to profitability for each customer, serving as a solid benchmark for maintaining steady and sustainable growth. :::
::: faq
How can I improve NRR without relying on new customers?
To improve Net Revenue Retention (NRR) without bringing in new customers, the spotlight should be on increasing revenue from your current customer base. Here’s how you can achieve that:
- Promote upgrades and cross-sells: Encourage customers to explore higher-tier plans or complementary products.
- Minimize churn and contraction: Focus on retaining customers and preventing downgrades or cancellations.
- Increase customer satisfaction and engagement: Happy, engaged customers are more likely to stick around and invest further in your offerings.
Keeping an eye on metrics like expansion MRR (Monthly Recurring Revenue from upgrades/add-ons) and contraction MRR (revenue lost from downgrades) can highlight areas where growth is possible. At the same time, refining your product and retention strategies will lead to better renewal rates and long-term success. :::
Related reading
- How your acquisition strategy influences your conversion rate
- How to A/B test pricing as a boostrapped company
- Upsell vs. Cross-Sell Metrics: Key Differences
- Digital Marketing Services
- What Is Strategy Consulting? (And when to hire a consultant to do it for you)
Useful tools & services
Go deeper than any blog post.
The full system behind these articles—frameworks, diagnostics, and playbooks delivered to your inbox.
No spam. Unsubscribe anytime.