PLG Metrics That Matter: The Dashboard Every Product-Led Team Needs
Focus your PLG dashboard on activation, retention, and expansion; use cohorts and alerts to predict revenue 60–90 days ahead.
PLG Metrics That Matter: The Dashboard Every Product-Led Team Needs
Tracking the wrong metrics can stall your growth. Many SaaS teams celebrate user growth but miss early warning signs like a drop in activation rates or longer time-to-value. By the time revenue declines, it’s often too late to fix the root problem.
The solution? Focus on leading indicators. Product-led growth (PLG) prioritizes metrics that predict future revenue, like activation rate, retention rate, and expansion revenue. These metrics show where users get stuck and help you act quickly to improve results.
Here’s what top PLG companies do differently:
- Activation rate: Measures how many users experience your product's core value. For example, Slack tracks when teams send 2,000 messages.
- Retention rate: Shows if users keep coming back. A 5% boost in retention can lead to 91% more users staying after a year.
- Expansion revenue: Tracks growth from existing customers through upgrades or add-ons. Companies with strong Net Revenue Retention (NRR) often hit 120% or higher.
Key takeaway: Build a dashboard that tracks these metrics, organized around the user journey (activation, engagement, monetization). Use cohort analysis to spot trends and set up alerts for quick action when metrics drop.
Put simply: The right metrics can help you predict revenue trends 60–90 days ahead and fix problems before they hurt your bottom line.
PLG Mastery 🔥 Top 5 Metrics That Fuel Product Led Growth 📈
::: @iframe https://www.youtube.com/embed/Ol6kMjzMOAs :::
Core Metrics Every PLG Team Should Track
Metrics tell the story of how your product is performing. While there are countless data points to consider, three key metrics stand out above the rest: activation rate, retention rate, and expansion revenue. These metrics are reliable indicators of growth, offering insights into your product’s health and potential revenue 60 to 90 days ahead.
Each metric answers a critical question. Activation rate reveals if users experience your product’s core value. Retention rate shows whether users continue to find value over time. Expansion revenue highlights if users are willing to spend more as their needs grow. Together, these metrics provide a clear picture of how well your product supports growth. Let’s dive into each one.
Activation Rate: Measuring First Value
Activation rate tracks the percentage of users who reach a moment of real value - when they understand why your product matters. This isn’t about completing a tutorial or onboarding steps; it’s about experiencing the product’s core value firsthand.
"Activation rate is the single best predictor of PLG success." - Jake McMahon, PLG & GTM Growth Consultant [2]
Defining activation depends on your product. For example:
- Slack defines it as sending 2,000 team messages.
- Dropbox sees it as adding a file from multiple devices.
- Calendly marks it as booking the first meeting [1].
Activated users are 10 times more likely to convert to paid plans compared to non-activated users [1]. On average, SaaS products have a median activation rate of 17%, with top performers achieving up to 65% [3].
Tracking activation by cohort is essential. For instance, if users who signed up last week show a 15% drop in activation, it could signal an issue introduced by a recent product change - something aggregate data might miss.
Retention Rate: Tracking User Engagement Over Time
Activation shows that users find initial value, but retention measures whether that value lasts. Retention rate reflects how many users return after their first session. While acquisition brings users in, retention ensures they stick around, amplifying their long-term value. Even a small 5% improvement in monthly retention can lead to 91% more users staying over a year [5].
Day 1 retention is a strong predictor of long-term engagement. It’s 73% accurate in forecasting Day 30 retention [4]. Top PLG companies achieve Day 1 retention rates above 40%, while others often struggle to hit 20% [4].
Strong retention signals product-market fit. If users keep coming back, your product has likely become a vital part of their workflow. On the other hand, low retention - despite good activation - suggests your product delivers initial value but fails to maintain it.
Many PLG teams now focus on retention first, flipping the traditional AARRR framework (Acquisition, Activation, Retention, Referral, Revenue) to RARRA (Retention, Activation, Referral, Revenue, Acquisition) [5][10]. This shift reflects the reality that retaining users is far more cost-effective than constantly acquiring new ones.
Expansion Revenue: Growing Revenue from Current Users
Once you’ve retained users, the next step is driving expansion revenue. This happens when existing users upgrade, add seats, or purchase additional features. Sometimes called "anti-churn", expansion revenue offsets losses from users who leave [10]. Top PLG companies generate 30–50% of their new revenue from expansion rather than new customer acquisition [7][1].
"Expansion revenue is the anti-churn, and one of the most important levers for SaaS growth." - Wes Bush, CEO and Founder, ProductLed [10]
Net Revenue Retention (NRR) is the go-to metric for expansion. An NRR of 120% means your existing customers increased their spending by 20% over the year, even without adding new users. Leading PLG companies achieve NRR rates between 120% and 150% [1].
Expansion revenue is also more cost-efficient - 2–3 times cheaper to generate than acquiring new customers [3]. Existing users already trust your product, making them easier to upsell. Usage-based pricing models are especially effective here, as customers naturally spend more as their usage grows, eliminating the need for a separate sales pitch.
To track expansion, look for behavioral signals that indicate readiness to upgrade. For instance:
- Users inviting teammates may need more seats.
- Customers reaching usage limits might benefit from higher-tier plans.
These moments are prime opportunities to encourage upgrades, ensuring you deliver value at the right time.
| Metric | Poor | Good | Excellent |
|---|---|---|---|
| Activation Rate (Simple SaaS) | <40% | 50–70% | >80% |
| Activation Rate (Complex SaaS) | <15% | 25–40% | >50% |
| Day 1 Retention | <20% | 30–40% | >40% |
| Net Revenue Retention (NRR) | <90% | 100–120% | >130% |
| Free-to-Paid Conversion (Freemium) | <2% | 4–8% | >10% |
How to Build a PLG Dashboard
Creating a dashboard that drives action, rather than just displaying data, is a challenge many teams face. The key lies in simplicity and focus. Too much data can overwhelm, while the wrong metrics can lead to wasted effort. A well-designed PLG dashboard prioritizes clarity and actionable insights.
Dashboard Design Principles That Matter
To design a dashboard that works, focus on the metrics that truly drive decisions. If your team can't recall the core metrics, you're likely tracking too many. Keeping it simple ensures focus and prevents distractions. Tracking more than 40 metrics, for instance, can dilute attention and obscure what really matters [4].
Kyle Poyar, Operating Partner at OpenView, emphasizes this approach:
"The best PLG companies obsess over one metric at a time. They don't try to move 12 dials simultaneously - they identify the biggest bottleneck, fix it, then move to the next." [1]
Your dashboard should prioritize leading indicators - metrics that predict outcomes, not just reflect them. For example, instead of tracking total users or MRR, focus on activation rate or time-to-value. These metrics can signal revenue trends 60 to 90 days in advance, giving teams time to adjust [4].
Metrics should prompt immediate action. If a drop in activation rate exceeds 5 percentage points week-over-week, for instance, it should trigger a review of recent product changes [4]. Additionally, cohort-based analysis is critical. Aggregate data can hide issues, like a stable activation rate masking declines in recent user groups [1][4][2].
Organize your dashboard around the user journey:
- Activation (Days 0–7): Highlight early user behaviors.
- Engagement (Days 7–30): Focus on retention and engagement patterns.
- Monetization (Days 30+): Track revenue and expansion trends [4].
Set up alerts for significant week-over-week changes, such as a 15% drop in key metrics or a PQL-to-customer conversion rate falling below 18% [4].
Tailoring Dashboards by Team Role
Different teams need unique views of the same data. Tailoring dashboards by role ensures everyone has the insights needed to perform effectively.
- Product Managers: Focus on product health metrics like activation rate, time-to-value, feature adoption, and DAU/MAU ratio [7][2][3].
- Marketing Teams: Highlight top-of-funnel metrics such as signup rates, organic vs. paid signups, PQL volume, and customer acquisition cost (CAC) [1][6].
- Sales and Customer Success Teams: Track conversion and expansion signals, including PQL-to-paid conversion rates, expansion revenue, usage limits, and Net Revenue Retention (NRR) [5][3][6].
| Team Role | Priority Metrics | Purpose |
|---|---|---|
| Product | Activation Rate, TTV, Feature Adoption, DAU/MAU | Assess product-market fit and onboarding [3][6] |
| Marketing | Signup Rate, Organic Mix, CAC, PQL Volume | Evaluate acquisition quality and channels [1][6] |
| Sales | PQL-to-Paid Rate, Expansion MRR, Usage Limits | Identify high-intent leads and upsell opportunities [5][6] |
| Success | NRR, Churn by Cohort, Health Scores | Ensure retention and account growth [1][2] |
Tools and Processes for Success
Aligning review schedules and tools with team needs is essential. For tactical metrics like signups and activation rates, a quick 15-minute review on Monday mornings works well. Strategic metrics like NRR and cohort retention might need a monthly deep dive [1].
When it comes to tools, start small. Early-stage teams can use Google Sheets for simplicity. As your ARR grows, consider tools like Metabase ($50–$200/month) for more advanced reporting. Platforms like Amplitude or Mixpanel ($500–$2,000/month) provide robust cohort analysis for deeper insights [1][4].
Modern PLG companies rely on data warehouses as their core system of record [11]. Using a Customer Data Platform (CDP) like Segment or RudderStack ensures all teams work with the same dataset. This eliminates silos and aligns product, sales, and marketing efforts [12].
Using Benchmarks to Evaluate Your Metrics
::: @figure 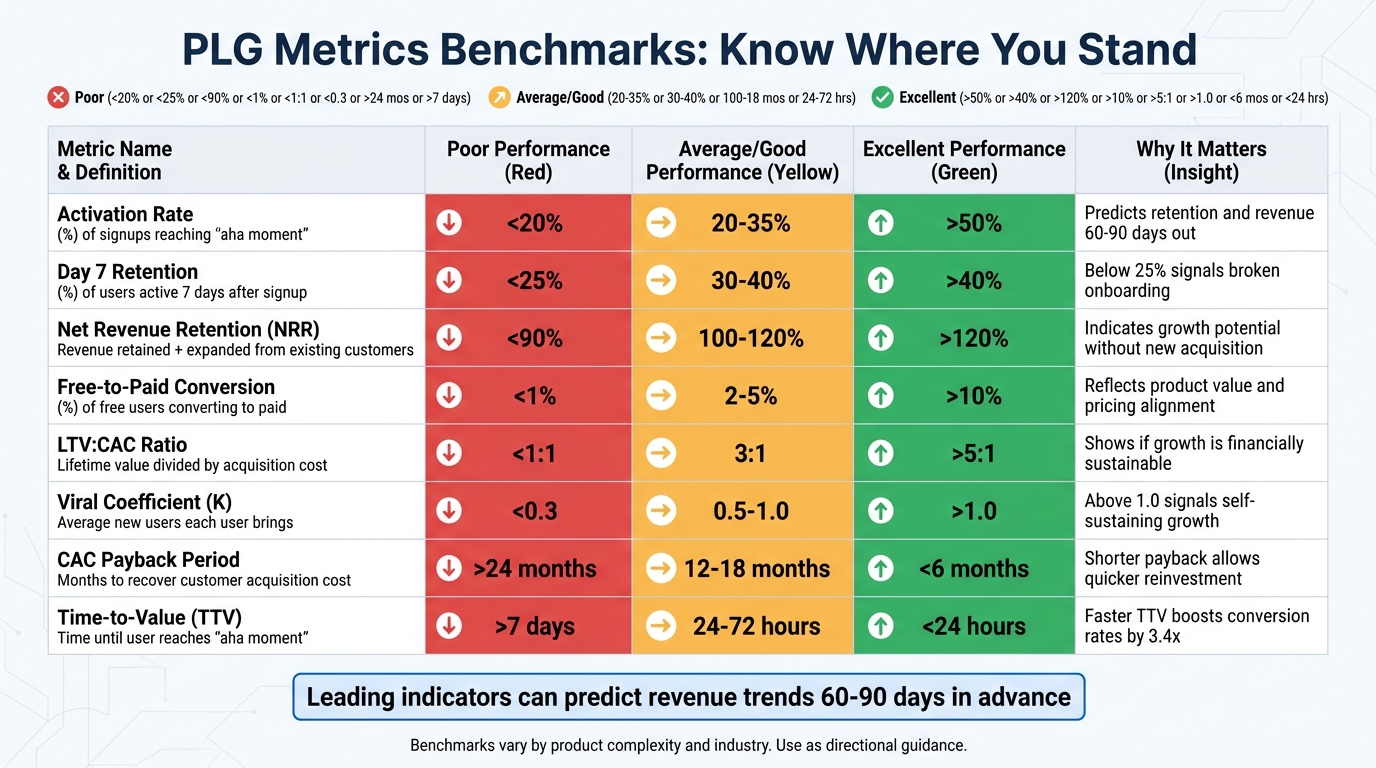 :::
:::
Tracking metrics without context can feel like navigating without a map - you might be moving forward, but there’s no way to tell if you’re heading in the right direction. That’s where industry benchmarks come in. They provide the context needed to assess whether your activation rate is lagging or your retention numbers are performing well.
However, finding the right benchmarks can be tricky. For example, aggregate data can be misleading. A tool like Slack, designed for daily communication, often hits a 40–60% DAU/MAU ratio, while analytics platforms tend to hover around 5–15% [5]. Simpler products often achieve activation rates above 80%, while more complex SaaS tools typically see rates over 50% [1]. Recognizing these differences is essential to aligning your metrics with your product-led growth goals.
Benchmarks become especially useful when paired with cohort analysis. Tracking metrics by cohort rather than in aggregate can reveal trends and shifts that might otherwise go unnoticed. For instance, a sudden dip in activation rates for a specific user group can highlight areas needing attention, even if overall metrics seem stable.
When setting alert thresholds, focus on the metrics that matter most to your growth. Instead of trying to optimize everything at once, prioritize key indicators. For example, set alerts if your PQL-to-customer conversion rate drops below 18% or if there’s a weekly 5-point dip in activation rates [4]. Metrics like activation rate and time-to-value are also strong predictors of future revenue, offering a 60–90 day window to address potential issues before they hurt your bottom line [4].
Here’s a quick reference table summarizing important PLG metrics and their benchmark ranges:
PLG Metrics and Benchmarks Reference Table
| Metric | Definition | Poor | Average/Good | Excellent | Why It Matters |
|---|---|---|---|---|---|
| Activation Rate | % of signups reaching "aha moment" | <20% | 20–35% | >50% [5] | Predicts retention and revenue 60–90 days out [4] |
| Day 7 Retention | % of users active 7 days after signup | <25% | 30–40% | >40% [5] | Below 25% signals broken onboarding [5] |
| Net Revenue Retention (NRR) | Revenue retained + expanded from existing customers | <90% | 100–120% | >120% [5] | Indicates growth potential without new acquisition [1] |
| Free-to-Paid Conversion | % of free users converting to paid | <1% | 2–5% | >10% [5] | Reflects product value and pricing alignment [5] |
| LTV:CAC Ratio | Lifetime value divided by acquisition cost | <1:1 | 3:1 | >5:1 [5][9] | Shows if growth is financially sustainable [9] |
| Viral Coefficient (K) | Average new users each user brings | <0.3 | 0.5–1.0 | >1.0 [2] | Above 1.0 signals self-sustaining growth [2] |
| CAC Payback Period | Months to recover customer acquisition cost | >24 months | 12–18 months | <6 months [5] | Shorter payback allows quicker reinvestment [5] |
| Time-to-Value (TTV) | Time until user reaches "aha moment" | >7 days | 24–72 hours | <24 hours [1] | Faster TTV boosts conversion rates by 3.4x [1] |
Best Practices for Tracking PLG Metrics
A solid tracking system forms the backbone of your PLG dashboard, ensuring every metric provides actionable insights.
Setting Up Reliable Data Tracking
The first step is to establish a dependable tracking system. Start by identifying your product's "aha moment" - that key action users take which correlates with long-term retention and conversion. Think actions like "invited a teammate" or "integrated a data source" rather than surface-level milestones like "logged in" [5][8].
Focus on 3–5 core metrics to keep your dashboard manageable. Examples include activation rate, time-to-value, and Product Qualified Leads (PQLs) [1][3]. Despite the fact that 91% of B2B SaaS companies with PLG strategies plan to increase their investment, only 34% are actively tracking activations [3].
Your tracking system should capture account-level data, not just individual user actions. This means aggregating behavior across entire teams to uncover adoption trends [13][4]. Use a common identifier, such as a Salesforce Account ID, to connect product usage, marketing attribution, and sales pipeline data into a unified view [6].
Set up automated alerts to flag when metrics deviate from acceptable ranges. For instance, you could configure Slack notifications to trigger if a core metric drops by 15% week-over-week [1][4]. These alerts can help you address issues before they impact revenue.
As your business grows, your tools should scale too. For startups with under $500,000 ARR, Google Sheets with manual updates may suffice. Between $500,000 and $2 million ARR, consider using Notion databases with automated data pulls. Beyond $2 million ARR, you'll likely need BI tools or product analytics platforms for real-time data and cohort analysis [1].
Once your tracking system is in place, the focus shifts to using these metrics to refine your strategy.
Using Metrics to Improve Your Strategy
With reliable tracking as a foundation, the next step is turning insights into action. The key is to focus on one metric at a time rather than trying to optimize everything at once [1]. Identify the biggest bottleneck, tackle it, and then move on to the next.
Set a regular review schedule: weekly for tactical metrics like signups and activation, and monthly for strategic metrics like Net Revenue Retention (NRR) and cohort retention [1][4]. Use 45–60 minute cross-functional meetings with product, marketing, and sales teams to analyze anomalies and assign ownership for further investigation [6]. Tracking metrics by cohort, rather than in aggregate, can reveal whether product changes are improving or hurting the user experience [1][4].
Pay attention to leading indicators that predict future outcomes. For example, users who hit their "aha moment" within 48 hours are 3.4 times more likely to convert to paid plans compared to those taking over 7 days [1]. If your time-to-first-value increases by more than 15%, audit your onboarding process to identify potential friction points [4]. These early signals give you a 60–90 day window to address issues before they affect your bottom line.
Conclusion: Building a Data-Driven Growth Culture
Key Takeaways for Product-Led Teams
Product Qualified Leads (PQLs) convert at 5–6 times the rate of traditional Marketing Qualified Leads (MQLs), yet only about 25% of product-led growth (PLG) companies currently track them [5]. This leaves a significant opportunity for teams that adopt this approach.
The most critical metrics to focus on include activation rate, retention, and expansion revenue. For example, users who hit their "aha moment" within 48 hours are 3.4 times more likely to upgrade to paid plans compared to those taking over a week [1]. A small 5% boost in monthly retention can lead to 91% more retained users after a year, which outpaces even a 50% increase in acquisition efforts [5]. Additionally, achieving Net Revenue Retention (NRR) above 100% ensures growth from your existing customers without having to rely entirely on new signups [1][5].
"The best PLG companies obsess over one metric at a time. They don't try to move 12 dials simultaneously - they identify the biggest bottleneck, fix it, then move to the next." - Kyle Poyar, Operating Partner, OpenView [1]
Leading indicators can predict revenue trends 60–90 days before they show up in lagging metrics like Monthly Recurring Revenue (MRR) [2][4]. This early insight allows teams to address potential problems before they hurt the bottom line. Monitoring cohort-specific trends is also key - for instance, a 15% drop in activation for a specific weekly cohort might reveal a product bug that overall monthly numbers wouldn’t catch [4].
These insights should guide your next steps toward immediate action.
Next Steps for Your PLG Dashboard
To refine your PLG dashboard, start with a clear definition of your product’s "aha moment." Avoid vague ideas like "seeing value" and instead focus on specific actions, such as "invited two teammates" or "generated the first report" [2]. Choose 3–5 core metrics that align with your growth stage. Early-stage teams should prioritize activation and time-to-value, while growth-stage companies should focus on expansion revenue and NRR [3].
Set up a review schedule: examine tactical metrics weekly and strategic ones monthly [1][4]. Create alerts to flag critical metric changes, like a 5-point drop in activation week-over-week, and assign responsibility for each metric to specific team members to ensure accountability [4][3].
Finally, reduce friction in your onboarding process to speed up time-to-value. Every hour of delay can lower activation rates by 3–5% [3][4]. With 91% of B2B SaaS companies planning to increase their investment in PLG by 2026 [3], building a strong dashboard now puts your team in a position to drive long-term growth through activation, retention, and expansion revenue.
FAQs
::: faq
How do I define my product’s “aha moment” for activation?
To figure out your product’s “aha moment,” focus on the point where users first experience its core value. This is often tied to the first action they take that clearly demonstrates how your product solves their problem. Dive into user behavior data to uncover this moment - look for actions or signals that show users have grasped your product’s value and how it fits their needs. :::
::: faq
What’s the difference between retention and churn (and which should I track)?
Retention measures how effectively your product keeps users engaged over time. On the other hand, churn tracks the percentage of users who stop using or cancel your product. Retention is a key indicator of ongoing user value and engagement - essential for growth. Meanwhile, churn sheds light on user loss and areas that may need improvement. While both metrics are important, retention should take priority since it directly reflects your product's success and long-term user satisfaction. :::
::: faq
How do I set alert thresholds without getting too many notifications?
When setting thresholds for alerts, focus on key metrics like activation rate or time-to-value. For instance, you might define performance ranges such as an activation rate exceeding 50%. Alerts should only trigger for significant deviations outside these ranges. This prevents unnecessary notifications and avoids overwhelming your team with minor fluctuations.
To keep thresholds effective, review them regularly using historical data. This ensures they stay relevant and actionable, helping your team concentrate on critical issues rather than getting distracted by noise. :::
Go deeper than any blog post.
The full system behind these articles—frameworks, diagnostics, and playbooks delivered to your inbox.
No spam. Unsubscribe anytime.