The First 48 Hours: What High-Converting SaaS Onboarding Flows Do Differently
Deliver core value within 48 hours: connect real data, complete one workflow, and re-engage users to boost activation and retention.
The First 48 Hours: What High-Converting SaaS Onboarding Flows Do Differently
When someone signs up for your SaaS product, you have just 48 hours to show them value - or risk losing them. Here’s why this window is critical and what successful companies do differently:
- 58% of users leave within 24 hours if they don’t see value. Another 14% leave by day two.
- Users who experience the product’s "aha moment" in 48 hours are 3.4× more likely to convert to paying customers.
- Every hour of delay in delivering value leads to an 8% drop in activation rates.
Put simply: Early activation is everything. The best onboarding flows focus on these three actions within 48 hours:
- Connect real data (not sample data).
- Complete one core workflow from start to finish.
- Engage again within 24 hours (e.g., invite a teammate or return to the platform).
Here’s how top SaaS companies deliver value fast:
- Simplify onboarding: Reduce steps and remove unnecessary fields.
- Focus on one core feature: Avoid overwhelming users with too much at once.
- Use interactive guidance: Help users complete real tasks, not just watch a tutorial.
The result? Faster activation, higher retention, and better conversions. In this guide, we’ll break down how to optimize your onboarding flow to make those first 48 hours count.
Time-to-First-Value: The Main Driver of Conversion
What Time-to-First-Value Means
Time-to-First-Value (TTFV) measures how quickly a user experiences your product’s core benefit after signing up. It’s not about watching a demo or completing a tutorial - it’s about the moment users realize your product’s value [6][7].
This metric is crucial because it confirms the user’s decision to sign up. Data shows that users who reach this moment within 48 hours are 3.4× more likely to convert to paid plans compared to those who take a week or longer [3]. Companies that prioritize faster value delivery also experience 30% lower churn rates [7].
Delays in reaching this moment come at a cost. Users who don’t hit an activation event within three days are 90% more likely to churn [6]. Worse yet, every hour of delay correlates with an 8% drop in activation [2]. The goal isn’t to rush users but to remove barriers between them and their first success. To make this work, you need to define your activation event clearly.
How to Find Your Activation Event
Identifying your activation event is the first step in reducing TTFV. This event is the action that predicts whether users stick around. For example, Slack’s activation event is sending 2,000 messages, while Dropbox’s is uploading the first file [1].
To find yours, start by segmenting users into two groups: those who stayed active beyond Month 2 and those who churned. Use analytics tools like Mixpanel, Amplitude, or PostHog to track user behavior during their first week. Then, run a correlation analysis to uncover which actions are most closely tied to retention [1].
Take inspiration from Senja, a testimonial collection platform. In December 2025, they grew from $0 to $250,000 in monthly recurring revenue by simplifying their activation path. By providing templates and reducing the steps needed to collect a first testimonial, they found that users who completed this milestone within 24 hours had 4× higher retention at 90 days [6]. Stories like these highlight the importance of optimizing TTFV.
Reducing TTFV Without Overwhelming Users
Once you’ve defined your activation event, focus on streamlining onboarding to deliver value quickly. The key is to show just enough to help users succeed. Products that highlight only 1–2 core features during the first session achieve a 61% activation rate, compared to just 24% for those that showcase 8+ features [2].
Use progressive disclosure to reveal complexity in stages. Show users only what they need for the current step. This approach can boost onboarding completion rates by 43% compared to overwhelming users with everything upfront [2]. Pre-populating data is another effective tactic. For example, a B2B project management SaaS added a pre-filled sample project and reduced signup fields from 8 to 2. This change increased their activation rate from 22% to 61%, while Month 2 retention rose from 12% to 34% [1].
Delay non-essential steps until after users experience value. Tasks like email verification, profile setup, and team invitations can wait. Each additional form field reduces completion rates by 5–10% [1]. Replace modal tours with inline guidance that helps users complete real tasks. The focus isn’t on teaching; it’s on delivering success as quickly as possible.
| Product Type | Target TTFV | Max Acceptable TTFV |
|---|---|---|
| Consumer SaaS | < 5 minutes | 30 minutes |
| SMB SaaS | < 1 hour | 6 hours |
| Developer Tools | < 2 hours | 24 hours |
| Enterprise B2B | < 4 hours | 48 hours |
"The single highest-leverage onboarding principle is also the most unglamorous: continuously remove steps between the user and their first successful action." – Atticus Li, Applied Experimentation Lead, NRG Energy [4]
The Ultimate SaaS Onboarding Playbook with Justin Hammond
::: @iframe https://www.youtube.com/embed/66vI5JHg2ak :::
Core Principles of High-Converting Onboarding
When it comes to creating onboarding flows that truly convert, three key principles stand out. These aren't just nice-to-haves - they're the structural foundation that separates successful onboarding from processes that lose users.
Collect Only the Data You Need
Every extra form field increases the chance users will drop off. Keep it simple. Tools like Google SSO or Magic Links can eliminate the friction of passwords entirely [3]. Postpone email verification until later - forcing it upfront can drop activation rates from 51% to 34% [2]. Focus on gathering only the essentials needed to deliver value, saving non-critical information for after users achieve their first success.
Here’s a real-world example: In 2025, a B2B project management SaaS cut its signup fields from 8 to 2 and swapped a lengthy 7-screen tutorial for a pre-filled sample project. The results were dramatic - activation rates jumped from 22% to 61%, and Month 2 retention rose from 12% to 34% [1]. Remember, every additional step between signup and value can lead to a 10–20% user drop-off [1].
Provide Immediate Access to Core Features
Users sign up because they want to solve a problem - not to fill out profiles or sit through tutorials. The best onboarding flows let them dive in right away, even if their setup isn’t complete.
For products that require more complex configurations, like API connections or data imports, offer a sandbox with sample data. This allows users to experience the product’s value while setup happens in the background [11]. Why does this matter? Users who connect real data within 48 hours have a 64% 90-day retention rate, compared to just 18% for those who stick with sample data [2]. The key is removing barriers to getting started.
Here’s an example: In August 2025, Athenic revamped its onboarding process under Max Beech, Head of Content. They reduced a 12-step flow to 7 steps, added Google SSO, and introduced demo data that allowed users to complete a workflow in under 2 minutes. These changes boosted activation rates from 42% to 81%, improved trial-to-paid conversion rates from 8% to 22%, and cut the median time-to-activation from 8.2 days to 1.6 days [3].
Use Interactive and Contextual Guidance
Mandatory modal tours that explain features don’t work. In fact, 40–60% of users skip them entirely [1][10]. Why? Because users want to take action, not memorize where buttons are located.
Instead, use inline prompts that guide users through meaningful tasks as they interact with the product. These prompts have a 43% completion rate, compared to just 18% for traditional modal tours [2]. Inline guidance focuses on helping users achieve real outcomes, not just navigating the interface.
"The job of onboarding is not to teach your product. The job of onboarding is to get users to their first moment of value as quickly as possible." – Anant Jain, Creative Director, Designpixil [10]
If you use checklists, keep them short - 3 to 7 items max. Anything longer feels like a chore and drives users away [11]. Each item should represent a meaningful milestone, not just a feature walkthrough. Celebrate progress with small rewards like achievement badges or progress indicators. These psychological triggers, leveraging the Zeigarnik effect, can boost completion rates by 20–30% [11][12].
The 48-Hour Onboarding Timeline
::: @figure 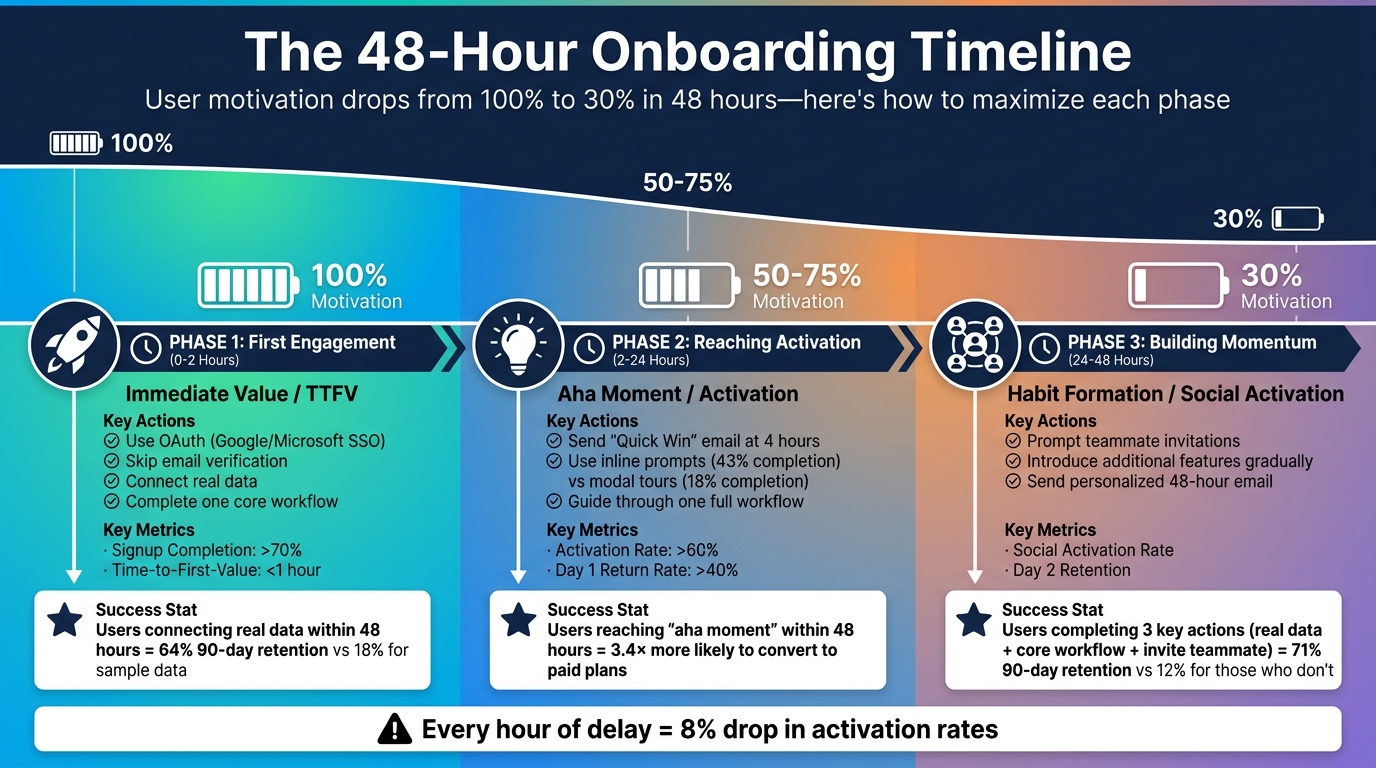 :::
:::
The first 48 hours of onboarding can be broken into three distinct phases, each with specific goals and challenges. User motivation starts high - 100% during signup - but drops quickly to 50% by the 24-hour mark and just 30% by 48 hours [2]. Structuring each phase thoughtfully can make all the difference in driving conversions.
Phase 1: First Engagement (0–2 Hours)
This is when motivation is at its peak, and users are most eager to engage. The priority here? Delivering immediate value.
Focus on a single, impactful action and remove distractions. Simplify the process by using OAuth options like Google or Microsoft SSO, which can boost activation rates by up to 64% [2]. Skip email verification for now and guide users toward connecting real data and completing a full workflow with the product's core feature.
A great example comes from DataSync. In August 2025, under the leadership of Priya Sharma, the team replaced their 5-step onboarding wizard with a streamlined process centered on connecting real data within the first 2 hours. This change reduced time-to-first-value from 18 hours to just 4.2 hours, increased activation rates from 28% to 52%, and boosted 90-day retention from 19% to 58% [2].
"The biggest mindset shift was realizing onboarding isn't about teaching features - it's about manufacturing success as quickly as possible." – Priya Sharma, Head of Product, DataSync [2]
Key metrics to monitor during this phase include Signup Completion Rate (aim for over 70%) and Time-to-First-Value (target under 1 hour) [1][2]. Users who connect real data within 48 hours are far more likely to stick around, with a 64% 90-day retention rate, compared to just 18% for those using sample data [2].
With users now engaged, the next step is to guide them to their "aha moment."
Phase 2: Reaching Activation (2–24 Hours)
By this point, motivation has dipped to 50–75% [2]. Without an early "aha moment", users may start doubting your product's value. The goal here is clear: get them to complete the activation event that strongly predicts long-term retention.
Behavioral triggers can help re-engage users. For instance, send a "Quick Win" email 4 hours after signup to highlight how they can achieve value within minutes. Avoid generic feature tours and instead use inline prompts that guide users through one full workflow - these have a 43% completion rate, compared to just 18% for modal tours [1][2].
Track metrics like Activation Rate (aim for over 60%) and Day 1 Return Rate (target over 40%) [1][2]. Users who experience their "aha moment" within 48 hours are 3.4 times more likely to convert to paid plans compared to those who take a week or longer [3].
Once activation is achieved, the challenge becomes building habits and encouraging social engagement.
Phase 3: Building Momentum (24–48 Hours)
By this stage, many users may feel the product isn't for them and quietly churn. The focus now shifts to forming habits and encouraging social interactions.
Prompt users to invite teammates, which increases their commitment and reduces churn. Introduce additional features gradually, but only after they’ve mastered the core workflow. At the 48-hour mark, send a personalized email based on their behavior: a "barrier removal" email for those who haven’t activated or a "next steps" email for those who have [1][9].
Users who complete three key actions within 48 hours - connecting real data, completing one core workflow, and inviting a teammate - achieve a 71% 90-day retention rate, compared to just 12% for those who don’t [2]. Focus on tracking Social Activation Rate and Day 2 Retention to measure success [2][9].
| Phase | Timeline | Motivation Level | Primary Goal | Key Metrics to Track |
|---|---|---|---|---|
| Phase 1 | 0–2 Hours | High (100%) | Immediate Value / TTFV | Signup Completion (>70%), TTFV (<1 hour) [1][2] |
| Phase 2 | 2–24 Hours | Moderate (50–75%) | "Aha Moment" / Activation | Activation Rate (>60%), Day 1 Return Rate (>40%) [1][2] |
| Phase 3 | 24–48 Hours | Low (30%) | Habit / Social Activation | Social Activation Rate, Day 2 Retention [2][9] |
Common Mistakes and How to Fix Them
Onboarding flows can make or break your conversion rates. Missteps during onboarding can delay users from reaching their first moment of value, which directly impacts activation. The gap between a 61% activation rate and a 24% activation rate often boils down to avoiding a few key mistakes [2]. Let’s dive into the most common pitfalls and how to address them.
Showing Too Many Features at Once
Bombarding users with too many features right away can lead to decision paralysis. Data shows that when users are introduced to 8+ features in their first session, activation drops to just 24%, compared to 61% when they’re guided through 1–2 core features [2]. Overwhelmed users are far less likely to take meaningful actions.
The solution? Use progressive disclosure. Introduce features gradually, only as they become relevant. For example, Linear’s onboarding starts by teaching users a single interaction - the Cmd+K command menu. Once inside the product, users find pre-populated tasks that guide them through actual workflows, eliminating the need for abstract tours [13].
To refine this approach, track your step-level completion rates. Identify where users tend to drop off and focus on simplifying those moments. Stick to guiding users through one action per session to keep things manageable.
But it’s not just feature overload that causes friction - demanding too much upfront can also derail progress.
Requiring Too Much Before Delivering Value
Every extra form field you add during signup reduces completion rates by 5–10% [1]. For instance, requiring email verification before users can access your product can drop activation rates from 51% to 34% [2]. Users arrive motivated, but that motivation fades quickly - every hour of delay between signup and their first moment of value results in an 8% decline in activation [2].
The fix is simple: remove unnecessary steps between signup and value. Use OAuth options like Google or Microsoft to bypass email verification altogether. Limit initial forms to just email and password. Skip profile questions, credit card details, and mandatory tutorials. Let users jump straight into the product and experience its value firsthand.
One B2B project management tool proved how effective this can be. They reduced their signup form from 8 fields to 2, postponed email verification until users upgraded to a paid plan, and introduced a 1-click pre-populated sample project. The result? Activation soared from 22% to 61%, and Month 2 retention increased by 183% [1].
Another common mistake? Treating all users the same.
Using the Same Flow for All Users
Not all users have the same needs, and a one-size-fits-all onboarding flow often leads to disengagement. Generic flows can cause a 30–50% drop in activation rates compared to flows tailored to specific user roles [8]. When users encounter irrelevant features or steps, they’re more likely to abandon the process.
The solution is intent-based routing. During signup, ask 1–2 quick questions like "What’s your role?" or "What do you want to automate?" [3][5]. Use their answers to customize the onboarding experience:
- Hide irrelevant features.
- Personalize checklists with tasks that matter to them.
- Tailor email sequences to match their specific goals.
This approach works. Users who complete personalized onboarding flows reach an 81% activation rate, compared to just 56% for those stuck in generic flows [3]. The key is to use the data you collect to streamline the experience and guide users to value as quickly as possible.
Conclusion
The first 48 hours after a user signs up are critical - they predict 90-day retention with an 89% accuracy rate [2]. During this window, users who activate are 3.4 times more likely to convert to paid plans compared to those who take a week or more [3].
Effective onboarding isn’t about overwhelming users with every feature or teaching them the entire product. It’s about getting users to achieve one meaningful action as quickly as possible [2]. Delay that moment, and you risk losing them - every hour of delay leads to an 8% drop in activation [2]. Extra form fields or verification steps? Those only speed up user drop-off [1]. The key is simple: reduce friction, deliver value fast, and tailor the experience to meet each user’s needs.
Successful companies know that user motivation fades quickly - from 100% in the first two hours to just 15% after 48 hours [2]. They’ve perfected the art of eliminating unnecessary steps. They skip email verification, avoid lengthy tutorials, and use progressive disclosure to prevent overwhelming users. They track activation metrics obsessively and iterate constantly, understanding that even a 1% increase in activation can lead to a 2% reduction in churn [11]. This relentless focus is what sets industry leaders apart.
"The single highest-leverage onboarding principle is also the most unglamorous: continuously remove steps between the user and their first successful action."
- Atticus Li, Applied Experimentation Lead, NRG Energy [4]
Onboarding isn’t static. It’s a system that requires ongoing measurement, testing, and fine-tuning. Start by defining your activation moment - the action that predicts retention - and then remove anything that slows users down. The 48-hour window closes quickly, but getting it right pays dividends for months.
Key Takeaways for High-Converting Onboarding
Small changes early in the user journey can lead to massive retention gains. Here’s what matters most:
- Speed to value: Aim for a time-to-first-value (TTFV) under 5 minutes [2][11]. Help users complete one core workflow before introducing more features.
- Simplify signups: Use OAuth logins to skip email verification, limit forms to just an email and password, and let users explore your product before asking for details or payment.
- Personalize the experience: Ask one or two quick questions during signup to guide users into workflows tailored to their goals [3]. Track where users drop off and streamline those points.
- Behavioral triggers: Replace time-based emails with automated messages triggered by user actions - or inaction - at 0, 4, 24, and 48 hours [1][4].
- Leverage psychology: Use checklists and progress bars to tap into the Zeigarnik effect, which motivates users to complete unfinished tasks [3][4]. Swap static tours for interactive walkthroughs where users complete real actions with their own data or pre-filled examples.
- Measure and iterate: Focus on key metrics like activation rate, time-to-value, onboarding completion, and 7-day retention [11]. Test relentlessly. For instance, in August 2025, Athenic reduced their onboarding steps from 12 to 7 and allowed users to run a demo with pre-filled data. The result? Activation jumped from 42% to 81%, adding $280,000 in ARR within a year [3].
The first 48 hours are your best chance to make an impact. Don’t waste them.
FAQs
::: faq
How do I choose the right activation event for my product?
Select an activation event that aligns with when users first experience the real value of your product. This event should highlight your product’s core purpose, indicate a strong chance of retention, and be something users can achieve early in their journey.
For example, it could be actions like completing a key workflow or inviting a teammate - steps that clearly demonstrate the product’s benefit.
To make this work, focus on personalizing the experience and helping users achieve quick wins. By guiding them toward this meaningful milestone, you set the stage for early engagement and long-term success. :::
::: faq
What should I remove from signup to speed up time-to-first-value?
To help users experience value faster, cut out steps that slow them down during signup. Simplify processes like email verification or long forms. Focus on removing anything non-essential and make it easy for users to get to their "aha moment" quickly. By reducing obstacles like drawn-out setups, you can boost activation rates and create a smoother onboarding experience. :::
::: faq
Which onboarding metrics matter most in the first 48 hours?
When it comes to onboarding, the first 48 hours are crucial. Four metrics stand out during this window: activation rate, time-to-value, completion of key actions, and 90-day user retention. These indicators provide a clear picture of early user engagement.
The goal during this period is to guide users to their "aha moment" as quickly as possible. This is the point where they realize the value your product offers. Encouraging them to complete three critical actions during this time is a strong predictor of long-term success.
By focusing on these metrics, you can create a solid foundation for better retention and higher conversion rates down the line. :::
Go deeper than any blog post.
The full system behind these articles—frameworks, diagnostics, and playbooks delivered to your inbox.
No spam. Unsubscribe anytime.