Why Most SaaS A/B Tests Fail Before They Start (Sample Size, Timing, and Segmentation)
Stop false A/B test winners: pre-calc sample size, run tests 14–42 days, and segment audiences before launch.
Most SaaS A/B tests fail because they’re not set up correctly from the start. The biggest issues? Using the wrong sample size, running tests for too short a time, and not segmenting the audience properly. These mistakes lead to unreliable results, wasted resources, and false conclusions.
Here’s what you need to know to avoid failure:
- Sample Size: Pre-calculate the minimum number of users needed to detect meaningful changes. Stopping a test too early or guessing the sample size inflates false positive rates.
- Test Duration: Always run tests for at least 14 days (or longer) to account for business cycles, especially for B2B SaaS. Avoid peeking at results before the test ends.
- Audience Segmentation: Define user groups (e.g., mobile vs. desktop, paid vs. organic) before the test. Poor segmentation can mask real insights or lead to misleading conclusions.
Revealed! The Shocking Reasons Why AB Tests Keep Failing!
::: @iframe https://www.youtube.com/embed/9jsgBbc51zw :::
Why SaaS A/B Tests Fail: The 3 Main Problems
A/B testing can be a game-changer for SaaS companies, but many experiments fail before they even begin. The culprits? Three common mistakes that derail tests and lead to unreliable insights.
Inadequate Sample Size
One of the most frequent errors in A/B testing is failing to calculate the required sample size upfront. Many teams fall into the trap of "peeking" - checking results daily and stopping the test as soon as they see a positive outcome. This practice, known as optional stopping, can skyrocket the false positive rate from 5% to over 30% [5]. Why? Because statistical significance isn’t static; it fluctuates throughout the test. What looks like a winner on day three might vanish by day ten as more data rolls in. Teams that stop early are three times more likely to ship false "winners" compared to those who follow pre-committed stopping rules [5].
Another issue is neglecting to calculate the Minimum Detectable Effect (MDE), which is the smallest improvement that matters to your business. For example, detecting a 1% lift in conversions requires significantly more data than detecting a 10% lift. For a SaaS company with a 3% baseline conversion rate and a 10% MDE, you’d need around 38,000 visitors per variation (76,000 total) to run a valid test [6]. Without these calculations, tests often lack the statistical power to detect real differences, leading teams to discard potentially winning variations based on insufficient data.
These sample size missteps create a ripple effect, setting the stage for timing and segmentation problems.
Improper Timing
Testing for too short a period - or during unusual times - can skew results. The problem? Regression to the mean. Early results, often based on small and unrepresentative samples, tend to shift toward the true average as more data comes in [6]. Without enough data, even perfect timing can’t fix flawed results.
"Statistical significance fluctuates throughout a test. If you check results daily and stop the moment you see a winning number... it inflates your false positive rate from 5% to well over 30%." - Mario Kuren, CRO Specialist [5]
Timing is especially tricky for SaaS businesses. For instance, B2B SaaS sites often see 30–50% higher engagement from Tuesday to Thursday compared to other days [5]. Running a test for just five days might capture weekday behavior but miss weekend trends entirely. High-impact experiments, like pricing changes, often need 4–6 weeks to reveal their full effects, especially since these changes typically influence downstream metrics like payment behavior rather than immediate page interactions [1].
Adding to the complexity, seasonal events, marketing campaigns, or mid-test product updates can distort results. These external factors might reflect temporary conditions rather than genuine user behavior, further compromising your test’s validity [6][7].
When combined with sample size issues, poor timing can make your results unreliable, no matter how well-designed the test is.
Poor Audience Segmentation
Even with the right sample size and timing, audience composition can make or break your test. Mixing diverse user groups often leads to misleading results. For example, a change might work well for mobile users but fail - or even backfire - for desktop users. This phenomenon, known as heterogeneous treatment effects, can mask the true impact of your changes [8]. A particularly tricky version of this is Simpson’s Paradox, where a variation appears to win overall but loses in every individual segment due to shifts in traffic mix during the test [8].
Another common mistake is testing changes on audiences that are too broad. For instance, testing a checkout button change across all site visitors - rather than just those who reach the checkout page - dilutes the effect. This added noise can mean you need up to 10× more traffic to detect meaningful changes [3].
On the flip side, excessive segmentation can also be a problem. If you analyze too many segments after a test, you’re almost guaranteed to find false "winners." At a p < 0.05 threshold, one in 20 segments will show statistical significance by pure chance [8].
"Aggregate results are averages, and averages lie when subgroups behave differently." - Atticus Li [8]
To avoid this, ensure each segment has at least 250–350 conversions per variation before drawing conclusions [8]. Poor segmentation choices can undermine even the most carefully planned tests, making your results less reliable.
How to Fix These Problems: 3 Practical Solutions
Now that you know what can go wrong with A/B testing, let’s dive into how to set things right. These three practical steps tackle the core challenges directly.
Calculate the Right Sample Size
Before you start any test, figure out the sample size you’ll need. To do this, you’ll need four key inputs: Baseline Conversion Rate (the current performance of the page), Minimum Detectable Effect (MDE) (the smallest improvement that matters to your business), Statistical Significance (typically set at 95%), and Statistical Power (commonly 80%) [9][6].
Here’s something to keep in mind: the relationship between MDE and sample size isn’t linear - it’s quadratic. This means doubling your MDE can reduce the required sample size by about 75% [9]. For example, if you’re testing a page with a 3% baseline conversion rate and want to detect a 10% improvement, you’ll need about 26,000 visitors per variation. But if you’re aiming for a 5% lift, you’ll need roughly 104,000 visitors per variation [9].
Tools like Optimizely, Evan Miller’s calculator, or AB Testguide can help you get these calculations right [9][10]. However, if your sample size calculation shows your test will take more than 8 weeks to complete, it’s time to rethink. You might need to adjust your MDE, pick a page with higher traffic, or even reconsider running the test altogether [9].
"If a sample size calculation produces a test duration over 8 weeks, stop and revisit the MDE. Either raise the MDE to something your traffic can support, find a higher-traffic page... or reconsider whether the test is worth running at all." - Atticus Li, Experimentation and Growth Leader [9]
Another key point: only assign users to the experiment when they encounter the change. For instance, if you’re testing a pricing page, group users into test variants when they reach that page - not earlier. This ensures your sample stays focused. For low-traffic pages, techniques like CUPED (Controlled Experiments Using Pre-Experiment Data) can help reduce the sample size needed [3][6].
Once you’ve nailed down the sample size, the next step is determining how long your test should run.
Set the Right Test Duration
After calculating your sample size, plan a test duration that captures a complete weekly cycle. Always run your tests in full-week increments - 7, 14, 21, or 28 days. This is particularly important for B2B SaaS sites, where engagement often peaks midweek (Tuesday through Thursday) [5]. To determine the duration, use this formula: Test Duration = Required Sample Size ÷ Daily Visitors per Variant.
Aim for a minimum of 14 days and a maximum of 4–6 weeks. This range helps you avoid distortions caused by seasonal trends or marketing campaigns. Also, pre-register your end date before starting the test. Stopping early or peeking at results can lead to false positives - up to three times more often than if you stick to your pre-committed timeline [5].
For email tests, the timeline is different. Most results (about 85%) come in within the first 24 hours of sending [10]. However, for B2B SaaS emails, it’s better to wait 48–72 hours before deciding on a winner, as the decision cycle tends to be longer. A quick rule of thumb: send each version to at least 20,000 recipients to improve the chances of reaching statistical significance [10].
Before analyzing results, always check for Sample Ratio Mismatch (SRM). If your intended 50/50 split ends up looking like 53/47, it could point to issues like bot traffic or caching problems, which can invalidate your test [5].
With your test duration locked in, the final step is to sharpen your audience segmentation.
Segment Your Audience Correctly
Segmenting your audience properly ensures your insights are actionable. Start by grouping users based on their stage in the funnel - such as visit, signup, activation, trial-to-paid, or expansion [1]. For example, separating free trial users from long-term subscribers or distinguishing between organic and paid traffic can reveal trends that might otherwise be hidden. A test that looks successful overall might actually underperform for high-value segments like enterprise customers or specific referral sources [1].
For activation tests, focus on feature-gated moments instead of calendar-based triggers. These “aha moments” often yield better results compared to generic onboarding changes [1]. Ideally, each segment should have at least 250–350 conversions per variation before drawing any conclusions [8]. If your segments are too small to hit this threshold, they might not provide reliable insights.
Low traffic? No problem. Use composite metrics to boost your baseline rate. For instance, instead of testing only for “completed purchase,” include related actions like “added to cart” or “started checkout.” This broader approach reduces the sample size you need [11]. Also, exclude any polluted traffic - such as visits from internal teams, bots, or QA sessions - to keep your data clean [5].
Here’s a practical example: If your data shows users who complete two specific onboarding steps convert at 40%, compared to just 8% for those who don’t, testing variations that encourage those steps can make a big difference. But don’t overanalyze - if you examine too many segments, you increase the risk of finding false positives. With a p < 0.05 threshold, one in 20 segments might appear significant by chance alone [8].
Putting It All Together: Sample Size, Timing, and Segmentation
::: @figure 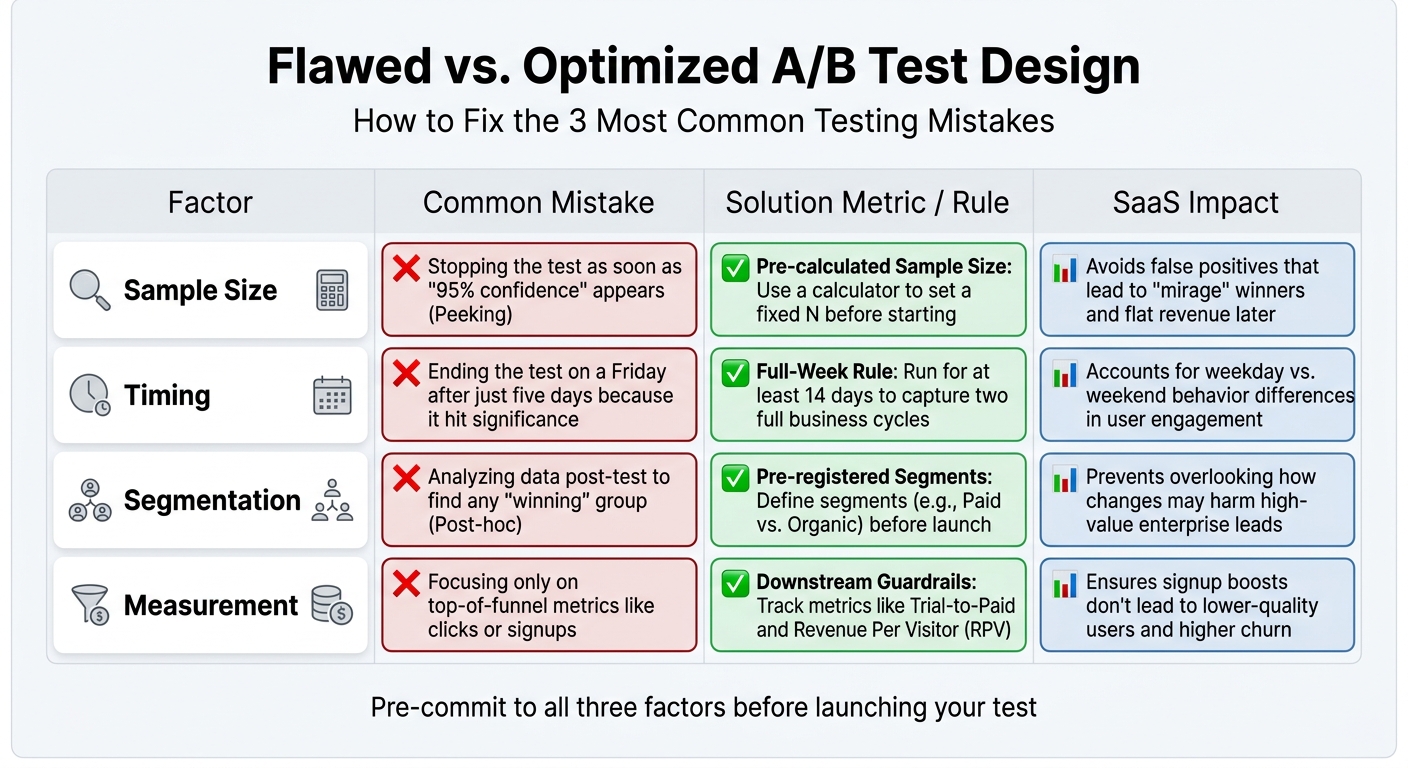 :::
:::
To run a successful test, you need to align sample size, timing, and audience segmentation right from the start. Begin by calculating your required sample size based on your baseline conversion rate and Minimum Detectable Effect. At the same time, define and document your audience segments - such as paid vs. organic traffic or new vs. returning users. This ensures your analysis remains objective and that the experiment is well-structured from planning through execution [2][12].
Once you’ve determined the sample size, calculate how long the test should run using the formula: Test Duration = Required Sample Size ÷ Daily Visitors per Variant. Always round up to full-week increments, with a minimum duration of 14 days, to account for complete business cycles. For example, B2B SaaS sites often see 30–50% more engagement from Tuesday to Thursday, so running a test for just five days could skew the results [5]. Setting a predetermined end date avoids the temptation to peek at early results, which can lead to premature decisions. Checking results too often - say 20 times before reaching your target sample size - can create a 50% chance of a false positive, undermining your test’s validity [6].
You’ll also want to track both primary metrics and guardrail metrics to monitor broader impacts. For instance, while a test might boost signups by 15%, it could simultaneously reduce the trial-to-paid conversion rate, resulting in "hollow growth" - higher signup numbers but no real revenue increase [1][12]. Guardrail metrics such as 90-day retention or support ticket volume help you spot these trade-offs and ensure your test supports sustainable growth.
Comparison Table: Flawed vs. Optimized Test Designs
Here’s a breakdown of common testing mistakes and how to fix them by integrating proper sample size, timing, and segmentation:
| Factor | Common Mistake | Solution Metric / Rule | SaaS Impact |
|---|---|---|---|
| Sample Size | Stopping the test as soon as "95% confidence" appears (Peeking) [2][5]. | Pre-calculated Sample Size: Use a calculator to set a fixed N before starting [2]. | Avoids false positives that lead to "mirage" winners and flat revenue later [2]. |
| Timing | Ending the test on a Friday after just five days because it hit significance [6][5]. | Full-Week Rule: Run for at least 14 days to capture two full business cycles [6][5]. | Accounts for weekday vs. weekend behavior differences in user engagement [6]. |
| Segmentation | Analyzing data post-test to find any "winning" group (Post-hoc) [12]. | Pre-registered Segments: Define segments (e.g., Paid vs. Organic) before launch [12]. | Prevents overlooking how changes may harm high-value enterprise leads [1][12]. |
| Measurement | Focusing only on top-of-funnel metrics like clicks or signups [1][5]. | Downstream Guardrails: Track metrics like Trial-to-Paid and Revenue Per Visitor (RPV) [1][12]. | Ensures signup boosts don’t lead to lower-quality users and higher churn [12]. |
Before rolling out any major testing program, it’s a good idea to run an A/A test for one week. This involves testing identical variants to confirm that your tracking and randomization systems are working correctly [5]. Additionally, check for Sample Ratio Mismatch (SRM) at the start of the test. For example, if a 50/50 split ends up as 53/47, it could indicate issues like bot traffic or technical errors that could invalidate your results [5].
Conclusion
A/B tests often fail when teams skip the basics: determining the right sample size, running tests for a sufficient duration, and segmenting audiences in advance. Here's how to avoid those pitfalls:
- Calculate your sample size before starting. Use your baseline conversion rate and the smallest lift you want to measure.
- Run tests for at least two full weeks. This ensures you account for variations across business cycles - B2B engagement, for instance, can differ by 30–50% between weekdays and weekends [5].
- Segment your audience upfront. Whether you're comparing paid versus organic traffic or enterprise versus SMB users, clear segmentation helps you avoid harming key customer groups while optimizing for overall results [1].
When you master these fundamentals, A/B testing becomes a powerful driver of growth.
And the results speak for themselves. Companies with disciplined testing programs enjoy conversion rates about 30% higher than those that rely on guesswork [4]. Microsoft, for example, achieved 10–25% improvements in critical metrics by following structured testing practices [4]. As Mario Kuren aptly puts it:
"Boring, rigorous testing produces compound results over time. Exciting, intuition-driven testing produces one good story and a lot of wasted traffic" [5].
It's also worth remembering that good statistical analysis doesn’t care about deadlines or stakeholder demands. Pre-committing to stopping rules prevents premature decisions based on early data. This approach ensures your outcomes are based on actual trends, not random fluctuations - avoiding the risk of false positives that fail to move the needle on revenue [2][5][6].
FAQs
::: faq
How do I pick a realistic minimum detectable effect (MDE)?
To select a meaningful Minimum Detectable Effect (MDE), consider the smallest impact that aligns with your business objectives and can be reliably identified given your traffic and sample size. Setting the MDE too low could unnecessarily extend your testing period, while setting it too high might cause you to overlook smaller, yet important, changes. Leverage statistical power calculations to ensure your MDE matches your baseline metrics, test duration, and confidence level, ensuring your results are both actionable and reliable. :::
::: faq
What should I do if my A/B test would take over 8 weeks?
If your A/B test runs longer than 8 weeks, it’s time to rethink your strategy to keep results reliable. Here’s how to fine-tune your approach:
- Determine the right sample size to ensure you can identify meaningful changes in a shorter period.
- Optimize timing and audience segmentation to avoid delays caused by seasonal trends or varying audience behavior.
By revisiting your test design, you can shorten the duration without compromising accuracy, lowering the chance of false positives. :::
::: faq
How many segments should I analyze without chasing false winners?
When analyzing different segments, it's important to strike a balance. Avoid breaking data into too many tiny segments, as this can lead to confusing or misleading outcomes. Instead, focus on the segments that align closely with your objectives. By doing so, you minimize the chance of identifying "false winners" - results that appear significant but aren't truly impactful. This approach keeps your analysis focused, clear, and useful for decision-making. :::
Related reading
- Cohort Analysis for SaaS: How to Spot Revenue Problems 90 Days Early
- Activation Metrics That Predict Retention
- How to Diagnose a Leaky SaaS Funnel in Under an Hour
- How to Use Discounts Without Hurting Revenue
- Top Upselling Techniques for SaaS Success
Useful tools & services
Go deeper than any blog post.
The full system behind these articles—frameworks, diagnostics, and playbooks delivered to your inbox.
No spam. Unsubscribe anytime.