Customer Health Scores That Actually Predict Churn (Not Just Track It)
Create predictive health scores that flag churn 30–90 days early, prioritize actions within 24 hours, and reduce churn by 15–25%.
Customer Health Scores That Actually Predict Churn (Not Just Track It)
Most customer health scores fail at their job. Why? They track past behavior instead of predicting future churn. This means you’re reacting too late to save at-risk accounts.
Here’s the fix: use predictive health scores. These go beyond basic metrics like logins and ticket volume. Instead, they combine leading indicators - like feature adoption, sentiment shifts, and unresolved issues - to flag churn risks early, often 30–90 days before they cancel.
What you’ll learn:
- Why traditional health scores fall short (hint: they rely on lagging data).
- The key metrics that actually predict churn, like DAU/MAU trends and decision-maker engagement.
- How to build a scoring system that’s actionable, accurate, and easy to maintain.
Quick takeaway: A strong predictive model can cut churn by 15–25% and boost customer lifetime value by 25%. If your health score isn’t prompting action within 24 hours, it’s just dashboard fluff.
::: @figure 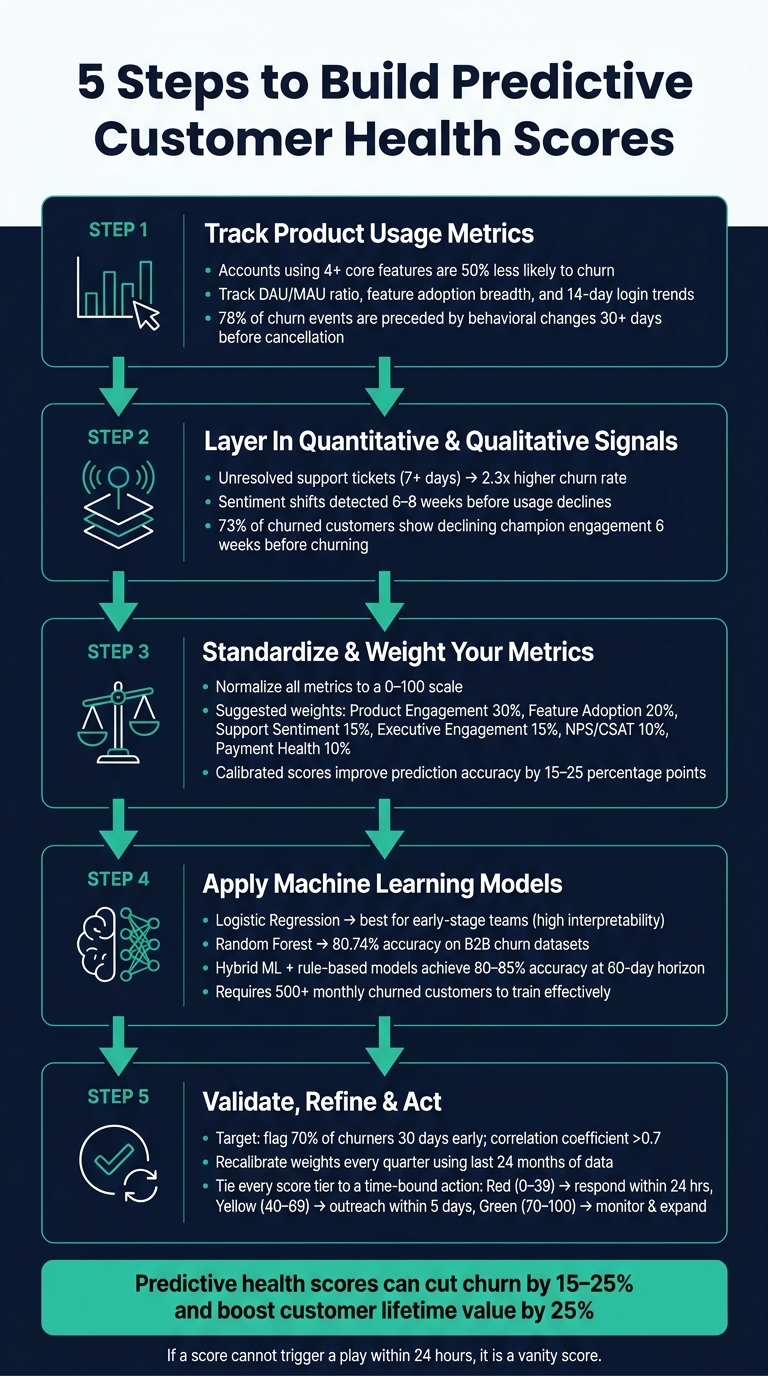 :::
:::
Customer Success Webinar Series: How to Build a Health Score that Actually Works
::: @iframe https://www.youtube.com/embed/X6tajMZ008s :::
Step 1: Start with Product Usage Metrics
To predict churn effectively, start by focusing on product usage metrics. These metrics reveal whether customers are truly gaining value from your product - not just what they say in surveys, but how they interact with the platform daily. As Jerome De Biasi from Pendo explains:
"Product usage data is the leading indicator. Other metrics lag behind, confirming what early behavioral data already shows." [6]
Key Product Usage Metrics to Track
Not all metrics are equally useful. For instance, login frequency alone provides limited insight. A customer logging in every day but not engaging with core features isn’t genuinely active - they’re just present. What matters is how they use the product.
Some of the most predictive metrics include:
- Feature adoption breadth: How many core features is the customer actively using?
- DAU/MAU ratio: This measures how consistently users engage with the product.
- Login frequency trend: A rolling 14-day average compared to the customer’s usual activity baseline.
Accounts that use four or more core features are 50% less likely to churn than those engaging with only one or two [5]. This highlights the importance of tracking depth of usage rather than surface-level activity like simple logins.
When defining "core features", focus on the 5–8 features that deliver the most value. Exclude actions like billing updates or settings changes, as they don’t reflect meaningful engagement [5].
Why Product Usage Predicts Churn
Churn doesn’t happen out of the blue - it follows a clear pattern of decline. First, there’s a drop in recency, then overall activity and engagement, and finally, customers stop hitting key milestones [9]. Usage metrics allow you to spot these patterns early, shifting your approach from reacting to churn to proactively addressing it.
In fact, 78% of churn events are preceded by behavioral changes at least 30 days before cancellation [8]. For example, a customer who has always logged in weekly and maintains that pattern is likely fine. But if a previously daily user hasn’t logged in for 10 days, it’s a red flag [5].
Another critical insight: accounts with a 15+ point drop in their health score over 30 days churn at 4x the average rate, even if their absolute score isn’t low [8]. This makes it essential to track changes over 30-, 60-, and 90-day periods rather than relying on static snapshots.
Armed with these metrics, you’re ready to combine product usage data with broader customer signals in the next step.
Step 2: Layer In Quantitative and Qualitative Signals
Relying solely on product usage data can be misleading. For example, a customer might log in regularly while an unresolved support ticket lingers, or a decision-maker might disengage even if the team continues to use the product. To get a full picture of customer health, it's essential to combine product usage data with support, sentiment, and engagement signals.
Engagement Signals to Focus On
When tracking support interactions, prioritize resolution over ticket volume. Here's why: accounts with unresolved support tickets older than 7 days churn at 2.3x the rate of accounts with fully resolved support histories [5].
"A single lingering support issue can dominate the customer's perception of your product regardless of everything else going well." - RetentionCheck [5]
Sentiment analysis can also be a game-changer. Tools like NLP (Natural Language Processing) can analyze support transcripts and calls to detect shifts in customer sentiment. These shifts often occur 6–8 weeks before usage declines [3]. Combining sentiment data with usage stats improves churn prediction accuracy by 45% compared to using usage data alone [3].
Another critical factor is relationship signals. For instance, monitoring the engagement of key decision-makers - like their response to emails or attendance at QBRs - can help identify "silent churn." This happens when daily users remain active, but decision-makers disengage. 73% of churned customers show declining champion engagement at least 6 weeks before churning [3][7].
Financial and Lifecycle Indicators to Watch
Payment-related issues often signal early involuntary churn. Failed payment attempts, disputed invoices, and expiring credit cards should trigger automated dunning protocols [5]. On the other hand, requests for seat reductions or plan downgrades are more direct and should be treated as immediate red flags [1].
Lifecycle milestones are equally important, particularly early on. For instance, if a new account is behind on onboarding tasks or taking longer than expected to achieve its first workflow ("time to first value"), this delay can indicate early-stage churn risk [1].
The table below outlines how different signal categories compare in terms of their predictive value and lead time before churn:
| Signal Category | Recommended Weight | Lead Time Before Churn |
|---|---|---|
| Support ticket resolution status | 20% | 14–30 days |
| Billing issue presence | 15% | 14–45 days |
| NPS / CSAT (most recent) | 10% | 45–90 days |
NPS detractors (customers scoring you between 0 and 6) are particularly telling. In B2B SaaS, they predict churn at roughly 4x the rate of promoters [5]. However, since NPS is a low-frequency signal, it should complement behavioral data rather than serve as the core of your model [2].
Step 3: Standardize and Weight Your Metrics
After gathering data on product usage, support interactions, sentiment, and financial signals, the next step is to combine and normalize these metrics into a unified health score. This involves converting varied data points - like login counts, ticket resolution times, NPS scores, and payment statuses - into a common 0–100 scale. Once standardized, these metrics can be weighted and combined into a single score that provides actionable insights.
How to Build a Weighted Scoring Framework
To standardize your metrics:
- For metrics where higher values are better (e.g., login counts), divide the current value by a benchmark and multiply by 100.
- For metrics where lower values are better (e.g., ticket resolution times), use the formula
(1 - value/max) × 100. - For boolean metrics (e.g., payment status), scale them to 0 or 100.
- Apply exponential decay for recency-based metrics to account for increased risk after 7–14 days of inactivity [10].
Once all metrics are scaled, assign weights to each one, ensuring the total equals 100. Use data - not intuition - to determine these weights. Analyze 12–24 months of historical customer data with logistic regression to identify which metrics correlate most strongly with churn [2]. Stick to 5–8 key inputs to balance simplicity and accuracy, avoiding overloading the score with unnecessary signals [2][10].
A well-weighted score calibrated against real churn outcomes can improve prediction accuracy by 15 to 25 percentage points compared to unvalidated, rule-based scores [2]. This score doesn’t just predict churn - it enables timely, targeted retention strategies.
A Sample Table for Comparing Metric Categories
Here’s an example of how to structure and weigh metrics for a mid-market SaaS business. The table includes suggested weights, update frequency, and the reasoning behind each metric’s inclusion:
| Metric Category | Suggested Weight | Update Frequency | Why It Predicts Churn |
|---|---|---|---|
| Product Engagement | 30% | Daily | Declining usage frequency is a strong early warning sign of disengagement [2][5]. |
| Feature Adoption Depth | 20% | Weekly | Accounts using 4+ core features churn at half the rate of those using just 1–2 [5]. |
| Support Sentiment | 15% | Daily | Negative trends or unresolved tickets indicate immediate customer frustration [2][5]. |
| Executive Engagement | 15% | Monthly/Quarterly | Lack of executive alignment or champion loss drives churn in mid-market accounts [2]. |
| NPS / CSAT | 10% | Survey cadence | Sentiment data is useful but tends to lag behind behavioral signals [2][5]. |
| Payment Health | 10% | Daily | Failed payments and dunning status directly precede involuntary churn [2]. |
Turning Scores into Action
Once you’ve built the composite score, map it to clear action tiers:
- Green (70–100): Accounts primed for expansion discussions.
- Yellow (40–69): Accounts requiring proactive outreach.
- Red (below 40): Accounts needing immediate escalation [5].
As Julien Quintard, Founder & CEO of Routine, explains: "If the score cannot trigger a play within 24 hours, it is a vanity score." [1] To maintain accuracy, recalibrate your weights quarterly. Customer behavior evolves, and weights that worked last quarter may no longer align with your product’s current state [2][10].
Step 4: Use Machine Learning to Build Predictive Models
Once you’ve established a weighted composite score, machine learning (ML) takes your customer health strategy to the next level. Instead of just identifying current behavior, ML predicts churn risk - up to 180 days in advance. That’s a significant improvement over the 30–90 day window most rule-based systems offer [11].
However, ML isn’t something you can jump into immediately. You’ll need enough churn data to train the model effectively. Aim for at least 500 monthly churned customers before transitioning from manual scoring to ML-based predictions [5]. Without sufficient data, the model won’t be reliable.
Choosing the Right Machine Learning Tools
For SaaS teams starting with ML, logistic regression is a great first step. It’s not the most advanced algorithm, but it’s easy to interpret. This clarity makes it simpler to explain results to non-technical team members and secure buy-in from leadership. Logistic regression highlights the specific signals driving churn risk, helping everyone understand the "why" behind the predictions.
As your data grows, you can move to more complex algorithms like tree-based ensemble models (e.g., Random Forest, XGBoost, or LightGBM). These handle non-linear relationships between variables - something logistic regression struggles with - and can automatically rank the most important features. For example, Random Forest models have achieved 80.74% accuracy on validated B2B churn datasets [2].
Here’s a quick comparison of popular ML algorithms:
| Algorithm | Ideal For | Trade-off |
|---|---|---|
| Logistic Regression | Early-stage SaaS teams | High interpretability; struggles with complex data |
| Random Forest | Mature SaaS with richer data | Handles non-linear signals; harder to interpret |
| XGBoost / LightGBM | High-volume, performance needs | Top accuracy; requires more engineering resources |
To make these models more accessible to your customer success team, use SHAP (SHapley Additive exPlanations) values. These explain model outputs in plain language, such as: "Low feature adoption reduced an account’s score by 12 points."
Training Models with Historical Customer Data
Once you’ve chosen the right ML tool, it’s time to train your model. Start by gathering 24 months of historical customer data. Capture key features at critical intervals (e.g., months 3, 6, and 9) to forecast churn over the next 12 months. This timeline helps the model recognize not just the warning signs, but when they’re likely to appear.
Before training, clean your dataset. Remove duplicates, fill in missing values, and normalize numeric fields (scaling them between 0 and 1). Then, use logistic regression to identify 5–8 key churn signals. Label customers as "1" for churn and "0" for retention. Including too many inputs can create unnecessary noise, so focus on the most impactful signals.
Split your data into two sets: 70% for training and 30% for testing. Use a time-aware split - train the model on earlier customer cohorts and test it on later ones. This ensures the model genuinely predicts future behavior without leaking data from the test set into training. Hybrid models, which combine rule-based scores with ML algorithms, can achieve 80–85% predictive accuracy at a 60-day horizon. That’s a big step up from the 60–70% accuracy typical of rule-based systems [2].
"A well-built machine-learned (ML) health score... learns directly from your historical data to surface early signs of churn, adapts as your product and customers evolve, and flags risk up to 180 days in advance." - Hook [11]
Finally, retrain your model every quarter. Customer behavior and product usage patterns change over time, so what worked six months ago may no longer be relevant. Regular updates ensure your predictions stay accurate and actionable.
Step 5: Validate and Refine Your Health Score Model
A health score model should do more than just explain churn - it needs to predict it effectively.
How to Test Your Health Score Against Actual Churn
Start by backtesting with historical data. Look at accounts that churned in the past 6–24 months and calculate their health scores 30, 60, and 90 days before they canceled [2][5]. If the scores show a steady decline leading up to churn, it’s a good sign your model has predictive power.
Next, evaluate the statistical correlation between health scores and actual churn outcomes. A correlation above 0.7 means the model is predictive, while anything below 0.5 suggests it’s not useful [2]. Peter Vogel, Founder of peppereffect, sums it up well:
"The line between vanity and predictive runs through one variable: regression validation." [2]
Aim for your model to flag 70% of churn cases early [5]. The best models should catch 90% of churn within the top 25% of risk scores [3]. Use the table below to see how your model measures up:
| Validation Metric | Target Benchmark | Action if Below Benchmark |
|---|---|---|
| Predictive Accuracy | >70% of churners flagged 30 days early | Recalibrate weights toward diverging signals |
| Correlation Coefficient | >0.7 | Re-evaluate signal selection via regression |
| False Positive Rate | <30% | Adjust score thresholds for "Yellow" and "Red" tiers |
| Risk Identification | 90% of churn in top 25% of risk scores | Increase weight of leading indicators |
Make sure to test accuracy for different customer segments separately - enterprise and SMB accounts often show distinct patterns [5][12].
Once you’ve validated your model, the next step is to continuously refine it.
How to Improve the Model Over Time
Validation isn’t a one-and-done task. Plan to recalibrate the model every quarter to keep up with changes in customer behavior. Assign a RevOps lead to run quarterly regression analysis using the most recent 24 months of data. This ensures signal weights stay relevant.
Set up alerts not just for static scores but also for significant shifts. For instance, a drop from 90 to 70 might signal churn more strongly than an account that consistently hovers at 70 [12]. When reviewing false positives and negatives, bring in your Customer Success Managers. They can provide qualitative insights that may not show up in the data [13].
"The more you let customer data (both qualitative and quantitative) influence adjustments to your customer health score, the better your health score will be at predicting churn." - Vitally Team [13]
The ultimate goal? Equip your team with the tools to take timely action and improve retention.
How to Act on Health Score Data to Retain At-Risk Customers
A health score only matters if it leads to action. As one expert puts it, "If the score cannot trigger a play within 24 hours, it is a vanity score" [1]. This underscores the importance of using health scores to drive timely and effective responses.
Setting Score Thresholds That Trigger Action
A simple yet effective way to act on health scores is by using a three-tier system. This system links specific score ranges to clear response protocols:
- Red (0–39): These accounts are in critical condition and need immediate attention, ideally within 24 hours. In many cases, this involves executive-level intervention.
- Yellow (40–69): These accounts are at-risk and should receive targeted outreach within 5 business days. The focus here is on addressing the specific issue that caused the score to drop.
- Green (70–100): These accounts are healthy and require ongoing monitoring. Look for opportunities to expand the relationship rather than intervening.
Score velocity also matters. For example, an account that drops 15 points in 30 days is four times more likely to churn, even if it’s still in the green range. A rapidly declining green account could be more urgent than a stable yellow one [8].
| Health Tier | Score Range | Response | Timing |
|---|---|---|---|
| Red / Critical | 0–39 | Immediate contact with executive escalation | Within 24 hours [5][2] |
| Yellow / At-Risk | 40–69 | Proactive outreach addressing the specific issue | Within 5 business days [5][2] |
| Green / Healthy | 70–100 | Monitor weekly and seek expansion opportunities | Ongoing [5][2] |
With these thresholds, you can take deliberate actions to address the root causes of score changes.
Retention Tactics That Work for At-Risk Accounts
To retain at-risk customers, focus on the specific signals behind their score drop. Avoid generic outreach - it’s rarely effective. Instead, align your tactics with the issue at hand:
- Low feature adoption: Share tailored educational content or schedule one-on-one training sessions to boost engagement.
- Billing issues: Start an automated dunning process right away. If the issue isn’t resolved within 48 hours, follow up manually.
- Relationship risks: When a key contact leaves or executive involvement wanes, act fast. Companies that align health scores with specific response steps see 2.3x better retention compared to those that don’t [3].
Strong relationships can make a huge difference. Salesforce found that accounts with engaged champions and clear ROI had a 94% renewal rate, while those with high usage but weak relationships saw only a 67% renewal rate. Their health-driven interventions also led to a 23% boost in expansion revenue [3].
One final tip: if you’re offering a renewal discount, tie it to a documented recovery plan that addresses the root causes of the score drop. Discounts alone won’t solve the problem - they just delay the inevitable churn.
Common Mistakes in Customer Health Score Implementation
Even the best-designed health scoring systems can fail if they're built on shaky assumptions or disconnected from everyday workflows. Two missteps, in particular, tend to derail these efforts.
Relying Too Much on a Single Metric
One of the biggest pitfalls is depending on just one signal - like login frequency - as a reliable indicator of customer health. The truth is, activity doesn’t always equal value. A customer might log in every day but still fail to use the features that align with their business goals.
"A customer who logs in daily without engaging key features may appear active, but lacks meaningful engagement." - Vitally [4]
Here’s the challenge: customer sentiment often changes 6–8 weeks before behavioral shifts show up in the data [3]. By the time you notice a drop in logins, the customer may already be disengaged. Instead of zeroing in on one metric, aim for a mix of 4–7 high-quality signals. These should cover product usage, relationship health, and financial indicators, with each metric weighted for its actual predictive value - not just ease of measurement. Companies using fewer than five well-chosen metrics see 23% better prediction accuracy compared to those juggling more than ten [3].
But identifying the right metrics is only part of the equation. The real magic happens when insights lead to timely, actionable steps.
Gathering Data Without Following Through
Another common issue is collecting great data but failing to act on it. Surprisingly, this happens more often than you’d think: while 68% of companies have health scoring systems, only 31% have defined strategies for responding to different score ranges [3].
"A red score without context leaves CSMs guessing, which means inconsistent playbook execution at best and paralysis at worst." - Jerome De Biasi, Pendo.io [6]
When a red flag appears without clear guidance, customer success managers (CSMs) are left scrambling - or worse, doing nothing. To avoid this, tie every score tier to specific, time-sensitive actions. Don’t stop at vague guidelines; make sure scores also highlight the reason behind the shift. For example, a label like "usage depth down 22%" gives CSMs something concrete to address [1][6]. Linking metrics to clear, immediate actions is key to reducing churn, proving the importance of a proactive, predictive approach.
Conclusion: Building Health Scores That Actually Reduce Churn
Key Takeaways for SaaS Teams
Creating a predictive health score takes time, but the results can be transformative. By focusing on core behavioral signals - like login frequency trends, feature adoption, and support ticket activity - SaaS companies can cut churn by 15–25% compared to relying on reactive retention strategies [5]. That difference between being proactive and reactive often determines whether revenue grows or shrinks.
To make health scores effective, there are a few must-haves: select high-quality signals, weight them based on their actual link to churn, normalize the data to a 0–100 scale, and ensure every score tier is tied to a clear, actionable step. If a score doesn’t prompt action within 24 hours, it’s not protecting your revenue - it’s just clutter.
"If the score cannot trigger a play within 24 hours, it is a vanity score." - Julien Quintard, Founder & CEO, Routine [1]
Static models won’t cut it either. Adaptive health models maintain over 65% prediction accuracy for 18 months, compared to just 42% for static ones [3]. Regular recalibration - at least quarterly - can prevent accuracy from slipping unnoticed.
Connecting Health Scores to Business Goals
The best SaaS teams don’t see health scores as just a customer success tool - they treat them as a revenue driver. Companies with strong health scoring systems enjoy a 25% boost in customer lifetime value [3]. That’s proof that a well-designed metric can directly impact growth.
One actionable way to strengthen this connection is by requiring a recovery plan before approving any discount for a Red-tier account. This approach ensures health scores influence commercial decisions, not just customer success workflows.
FAQs
::: faq
How do I pick my “core features” for a predictive health score?
When selecting the core features for a predictive health score, focus on metrics that reveal customer churn or retention patterns. Some key indicators to consider include:
- Product usage: How often and effectively customers use your product.
- Engagement levels: Are users actively interacting with your platform?
- Support interactions: Frequency and nature of customer support requests.
- Customer feedback: Metrics like Net Promoter Score (NPS) can highlight satisfaction levels.
- Billing and renewal data: Payment history and renewal trends offer clear signals.
You can also integrate behavioral analytics, track activity recency, and monitor milestone achievements. To prioritize the most meaningful metrics, use weighted formulas that give more emphasis to those with stronger predictive power. Over time, tweak and validate your model to keep improving its accuracy. :::
::: faq
What’s the minimum data I need before using machine learning for churn prediction?
To predict churn with machine learning, focus on gathering essential customer behavior data. This includes details like login frequency, feature usage patterns, support ticket activity, billing issues, and customer satisfaction ratings. By combining these metrics, you can create a predictive health score that highlights customers who might be at risk, allowing you to take proactive steps to retain them. :::
::: faq
How do I set score thresholds that trigger the right actions without too many false alarms?
To gauge customer health effectively, use a weighted, predictive scoring system. This approach combines key behavioral signals - such as activity levels, engagement patterns, and achieved milestones - and normalizes them on a 0-100 scale.
Define clear score ranges to categorize customer health. For example:
- 80-100: Healthy
- 40-79: At risk
- Below 40: Critical
Calibrate these ranges using historical churn data to ensure they reflect real-world patterns. Over time, adjust thresholds based on observed customer behavior. This ongoing refinement helps reduce false positives and negatives, ensuring your system accurately identifies when early intervention is needed. :::
Go deeper than any blog post.
The full system behind these articles—frameworks, diagnostics, and playbooks delivered to your inbox.
No spam. Unsubscribe anytime.