Customer Activation Metrics: The 7 KPIs Every Product Team Should Track
Track seven activation KPIs—activation rate, visitor-to-signup, signup-to-subscriber, DAU/MAU, feature adoption, time-to-value, account activation—to turn trial
90% of trial users never become active, and apps lose 95% of new users within 90 days. The solution? Focus on customer activation - the stage where users experience your product's value. This guide breaks down 7 key metrics to help SaaS teams improve activation rates, retention, and revenue:
- Activation Rate: Tracks the percentage of new users who discover your product's core value.
- Visitor-to-Signup Rate: Measures how effectively visitors convert into signups.
- Signup-to-Subscriber Rate: Shows the percentage of trial users who become paying customers.
- DAU to MAU Ratio: Indicates how often users engage daily compared to monthly.
- Feature Adoption Rate: Evaluates how consistently users engage with specific features.
- Time to Activation: Measures how quickly users experience value after signing up.
- Account Activation Rate: Tracks the percentage of accounts reaching their "aha moment."
Boosting activation rates by just 25% can increase monthly recurring revenue by 34% in a year. Start by defining your "aha moment", simplifying onboarding, and using data to identify friction points. Even small improvements in these metrics can lead to long-term growth.
::: @figure 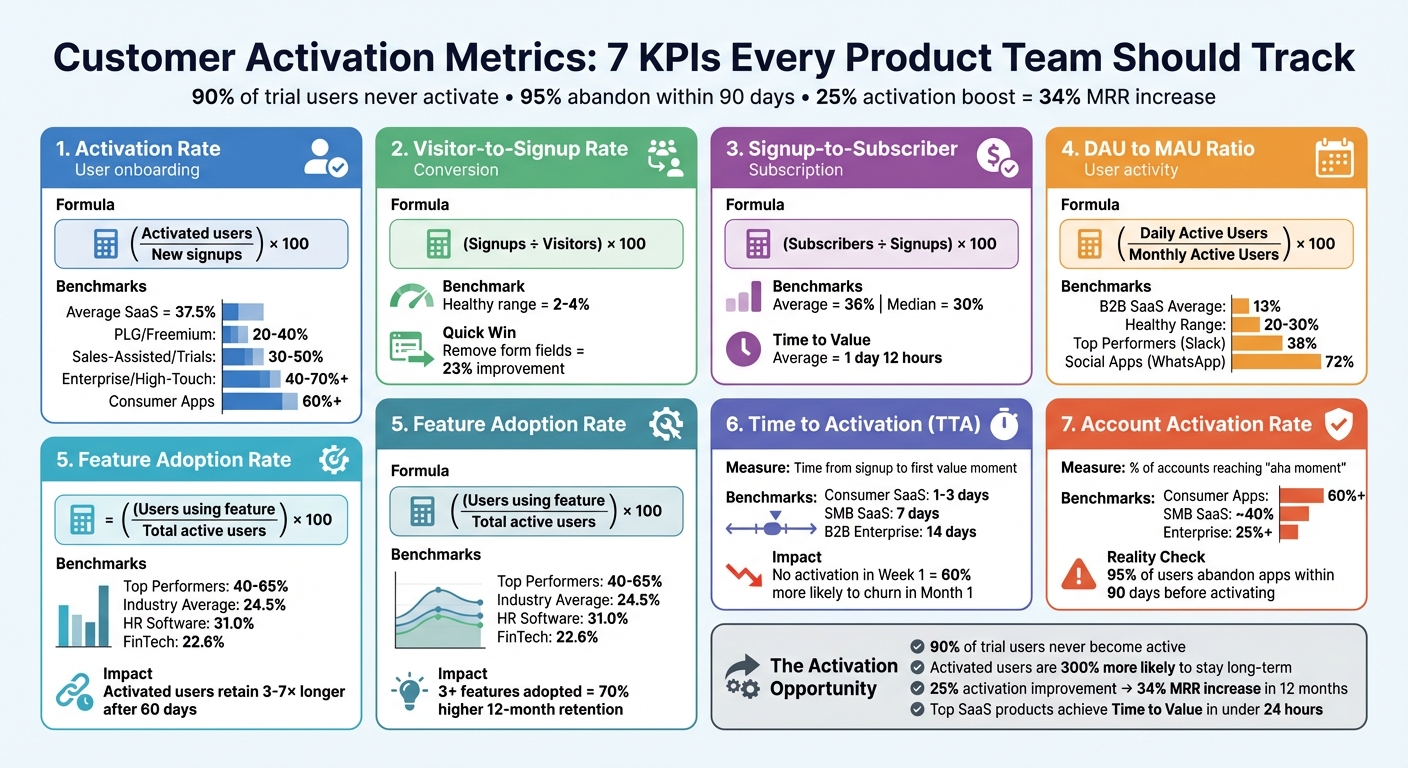 :::
:::
How to Master Activation Metrics for Your Product
::: @iframe https://www.youtube.com/embed/qHKWFo9senQ :::
1. Activation Rate
The activation rate shows the percentage of new users who hit a milestone that signals they've discovered your product's core value - their "aha moment." It’s calculated as:
Activation rate = (Activated users / New signups) × 100 [5][10].
Here’s why this matters: Users who reach activation tend to stick around 3–7× longer than those who don’t, even after 60 days [6]. Simplifying onboarding can work wonders too - cutting steps by 30% has been shown to increase activation rates by up to 50% [6]. A great example is The Room, a talent connection platform. By introducing walkthroughs with Userpilot, they guided users through key features and saw a 75% jump in activation within just 10 days [4]. Clearly, activation plays a major role in driving engagement and, ultimately, revenue.
Impact on Customer Activation
The activation rate is a key marker of how many signups transition into engaged users. It acts as a crystal ball for customer health, revenue potential, and how well your product fits the market [9][10]. By tracking this metric, you can identify where users lose interest early on and take steps to turn casual visitors into loyal customers [3].
Measuring and Tracking Activation
While the formula itself is simple, the real challenge is deciding what "activation" means for your product [8][9]. To get it right, your activation event must:
- Be tied to value (predicts retention).
- Be trackable (observable user actions).
- Happen early in the user journey [5].
The timeframe for activation depends on your product's complexity - simple apps might measure it within 24 hours, while enterprise solutions could take 30–90 days [6][12]. Segmenting users by acquisition channel, persona, or use case can also help uncover friction points. If activated users aren’t retaining or converting as expected, it might be time to redefine your activation criteria [5][12].
Why It Matters for SaaS Products
A high activation rate signals that your onboarding process is working and that your product is solving real user problems [4][8]. On average, SaaS activation rates hover around 37.5%, but they vary widely depending on the business model:
| SaaS Model | Average Activation Rate |
|---|---|
| PLG / Freemium | 20–40% |
| Sales-Assisted / Trials | 30–50% |
| Enterprise / High-Touch | 40–70%+ |
| Consumer Applications | 60%+ |
Take Dropbox as an example. They defined activation as a user uploading their first file via the desktop app. By adding a visual walkthrough and gamified progress tracker, they found that users who uploaded a file during their first session had 4× better Day 30 retention and were 25% more likely to upgrade [10].
How to Improve Activation and Engagement
Start by analyzing your most successful users. What early actions set them apart from those who churn? This backward approach can help you pinpoint the true activation milestone and refine your strategy to create that "aha moment" [6][8].
Speed up time-to-value by removing unnecessary steps. For example, use templates, pre-filled data, or sample projects to help users achieve a quick win within their first five minutes [9][10][11]. Progress trackers and checklists are also great tools to guide users toward key actions [4][10].
If users stall before reaching activation, automated nudges like behavior-based emails or push notifications can help. Intercom, for instance, defined activation as installing their chat widget and sending a first response. They used tooltips and a launch checklist to guide users, discovering that activated users were 6× more likely to convert to paying customers. Plus, their sales cycle for Product Qualified Leads shortened by 32% [10].
Finally, keep an eye out for signs of friction - like form abandonment, error rates, or "rage clicks." Onboarding flows alone can boost activation rates by an average of 32% [6]. Adding welcome surveys to tailor the experience based on user roles can make the process even smoother [4][10].
2. Visitor-to-Signup Rate
Visitor-to-signup rate = (Signups ÷ Visitors) × 100 [1]. Signing up is a pivotal first step in the activation process, signaling that a visitor sees potential in your product to address their needs. This metric lays the groundwork for understanding how effectively your product draws users into the activation journey.
Impact on Customer Activation
Think of this metric as the "front door" to your activation funnel [1]. If your visitor-to-signup rate is low, you’re starting with a smaller pool of users to guide toward key milestones. On the flip side, a high signup rate might not always be a win - especially if it attracts users with little intention to engage further [14]. By tracking this metric, you can assess whether your messaging and positioning clearly communicate your product’s value before users take the plunge.
Ease of Measurement and Tracking
This metric is straightforward to measure using basic web analytics - just compare the number of visitors to the total signups [1]. Anthony Martin, CEO of Choice Mutual, shares his approach to tracking:
"We check in with these metrics on a monthly basis: this ensures the marketing and customer service policies we implement are staying on track, but also allows enough time to give new ideas and strategies a chance to develop." - Anthony Martin, Choice Mutual [1]
Regular monthly check-ins provide enough time to evaluate the impact of new strategies while keeping efforts aligned with your goals.
Relevance to SaaS Product Adoption
For SaaS products, especially those driven by Product-Led Growth, the signup moment is a key turning point. It shifts a visitor’s curiosity into direct engagement, initiating the onboarding process and starting the countdown to "Time to First Value." A strong visitor-to-signup rate ensures a larger pool of users who can potentially become engaged customers. As a general benchmark, a conversion rate between 2% and 4% is often considered a healthy range for turning visitors into signups [15].
Actionability for Improving User Engagement
To boost this metric, focus on identifying and reducing friction in the signup process. Tools like heatmaps and session replays can reveal which call-to-action buttons are being ignored [1]. Look for signs of frustration, such as "rage clicks" or form abandonment, to pinpoint problem areas [5]. Segmenting your data by acquisition channel or user persona can also highlight which sources bring in higher-quality traffic. Simple tweaks can make a big difference - removing unnecessary form fields can improve conversions by about 23%, while adding social proof can drive a 19% increase.
3. Signup-to-Subscriber Rate
Once you've tracked engagement from signups, the next step is understanding how many trial users transition into paying subscribers. The formula is straightforward: Signup-to-subscriber rate = (Number of subscribers ÷ Number of signups) × 100 [3]. This metric highlights the percentage of trial users who decide your product is worth paying for, indicating they've recognized its core value [3][4].
Impact on Customer Activation
This rate serves as a litmus test for whether users have hit their "Aha! moment" - a pivotal sign of successful activation [3]. A high signup-to-subscriber rate suggests your onboarding process effectively demonstrates the product's benefits. On the flip side, a low rate points to friction in the user journey, preventing trial users from seeing the value in upgrading [4]. The stakes are high: boosting user activation by 25% can lead to a 34% increase in monthly recurring revenue over a year [4].
Ease of Measurement and Tracking
To measure this KPI, divide the number of paying subscribers by total signups, then multiply by 100 [3]. SaaS companies typically see an average activation rate of 36%, with the median around 30% [4]. Monthly tracking works well for most teams - it allows enough time for new strategies to show results while keeping performance trends in focus.
Relevance to SaaS Product Adoption
For SaaS businesses, this metric confirms whether your value proposition and pricing resonate with users. On average, SaaS products have a "Time to Value" of 1 day and 12 hours [4], meaning users decide fairly quickly if your product solves their problem. Since different user personas might convert at varying rates, segmenting the data by role or industry can uncover which groups are most likely to subscribe [4][5]. A strong signup-to-subscriber rate is essential for driving activation and steady revenue growth.
Actionability for Improving User Engagement
Focus on the first few minutes after signup to understand user behavior. Use interactive walkthroughs and tooltips to spotlight premium features [3][4]. Simplify setup steps and guide trial users toward the most compelling parts of your product [3][4][5]. Feedback tools like NPS or CSAT surveys, specifically targeting trial users, can help pinpoint what's working and where users hesitate during these critical early stages [3][4].
4. DAU to MAU Ratio
The DAU to MAU ratio (Daily Active Users to Monthly Active Users) offers a snapshot of how well your product turns occasional users into regular ones. This metric measures "stickiness" - or the likelihood that a monthly user will engage with your product on any given day. To calculate it, divide your daily active users by your monthly active users and multiply by 100. For instance, if you have 2,000 daily users and 10,000 monthly users, your DAU/MAU ratio would be 20%. This ratio, like others such as Activation Rate, is critical for understanding long-term engagement and the habit-forming potential of your product.
Impact on Customer Activation
A strong DAU/MAU ratio suggests that users have moved beyond the initial "aha moment" and are consistently finding value in your product. When users incorporate your product into their daily routines, it signals successful activation transitioning into lasting engagement. On the flip side, a declining ratio could hint at possible churn, giving you a chance to address issues early.
Ease of Measurement and Tracking
Start by defining what "active" means in the context of your product. Instead of simply counting app opens or logins, focus on meaningful actions that reflect value - like sending a message, running a report, or completing a key task [16][17]. To reduce noise from daily fluctuations, use a 28-day rolling average. For B2B SaaS products, an average ratio of 13% is common, while a healthy range is typically between 20–30%. Top-performing platforms like Slack reach around 38%, while social apps such as WhatsApp can hit as high as 72% [16].
Relevance to SaaS Product Adoption
The natural usage pattern of your product can influence what this ratio means for you. For example, B2B tools often used 3–4 times per week might see a healthy ratio of about 20%, aligning with a typical five-day workweek [16][17]. For products not designed for daily use - like project management or payroll tools - tracking Weekly Active Users to Monthly Active Users (WAU/MAU) might be more appropriate [16][18]. Spotify, for instance, boosted its DAU/MAU ratio from 25% to 42% by introducing personalization features that encouraged daily use [16].
Actionability for Improving User Engagement
Segment your users based on their DAU/MAU ratio: power users (above 60%), core users (30–60%), casual users (10–30%), and at-risk users (below 10%). This segmentation helps you tailor engagement strategies, focusing retention efforts on at-risk users while nurturing your most loyal ones. To drive daily engagement, implement habit loops with personalized cues, core routines, and rewards like streaks or progress tracking. Duolingo, for example, maintains a solid ratio of 25–30% by using gamification tactics such as daily goals and streaks. If your 30-day retention rate falls below 50%, it’s worth revisiting how you define an "active user" [16].
5. Feature Adoption Rate
Feature adoption rate looks at how consistently users incorporate a specific feature into their routine. To calculate it, divide the number of users actively using the feature over a set period by the total number of active users, then multiply by 100 [21]. It's essential to distinguish between occasional users, or "tourists", and consistent users, or "residents", since genuine adoption involves regular engagement and clear value gained from the feature [19][20][22][23].
Impact on Customer Activation
Feature adoption plays a critical role in predicting long-term retention. Research shows that users who adopt three or more features have a 70% higher retention rate after 12 months compared to those using only one feature [7]. While initial activation metrics capture early engagement, feature adoption reveals when a product becomes essential to users. This is often tied to the "aha moment" - the point when the product delivers undeniable value [7][19]. For instance, users who interact with new features within their first week are 3.7 times more likely to stay engaged after six months compared to those who delay exploring features for over 30 days [22]. However, about 80% of SaaS product features see little to no consistent usage [22], highlighting missed opportunities for deeper engagement.
Ease of Measurement and Tracking
To track feature adoption effectively, set clear thresholds that indicate sustained engagement [20][23]. Measure the entire adoption journey, from exposure (users seeing the feature) to discovery (first-time use) to activation (repeated use) [21][24]. It's important to evaluate both the breadth of adoption (how many users engage) and the depth (how extensively they use advanced functionality). Top-performing SaaS companies report adoption rates between 40% and 65%, while the industry average is around 24.5% [22]. For example, HR software averages 31.0%, while FinTech lags behind at 22.6% [22]. These metrics provide a clearer understanding of how adoption influences overall product engagement.
Relevance to SaaS Product Adoption
Adoption rates vary significantly depending on the industry and company size. For instance, mid-market companies (with revenues between $5M and $10M) average a 30.4% adoption rate, while smaller and larger enterprises often face challenges due to limited resources or increased complexity [22]. Slack demonstrated the power of targeted improvements in 2025 by increasing thread adoption from 23% to 67% among daily active users in just 90 days. They achieved this by introducing in-app prompts that encouraged threading during peak activity [22]. Similarly, HubSpot simplified its onboarding process by reducing the number of required form fields from 11 to 4, which led to a 120% boost in conversions by easing the initial user experience [7].
Actionability for Improving User Engagement
Improving feature adoption requires removing barriers between discovery and value. Features should be introduced at the right moment in a user's workflow, rather than hidden in less accessible menus [20][22]. Additionally, segment adoption data by user roles or personas, as different users prioritize different features. For example, a project manager might focus on collaboration tools, while an engineer values technical integrations [19][21]. A great example is Senja, a SaaS platform for collecting testimonials. By streamlining the process from signup to the first testimonial collection, they doubled their activation rate and grew to $250,000 in monthly recurring revenue. Users who collected their first testimonial within 24 hours were four times more likely to stay engaged after 90 days [7]. Similarly, The Room boosted weekly CV uploads by 75% in just 10 days by adding a user interface prompt encouraging the action [24].
"We don't just measure if people use features - we measure if features change user behavior in ways that predict retention and expansion."
– Des Traynor, Co-founder, Intercom [22]
6. Time to Activation
Time to Activation (TTA), often called Time to Value (TTV), tracks how long it takes for a user to go from signing up to experiencing the product's value for the first time [25][26]. To calculate TTA, subtract the signup time from the time of the activation event. For instance, in a messaging app, this might mean sending the first message, while in analytics software, it could involve creating the first dashboard [25]. This metric is crucial because it shows how quickly users can realize the product's value.
Impact on Customer Activation
How fast users experience value can strongly influence their engagement over time. Data shows that users who don’t activate within their first week are 60% more likely to churn within the first month [25]. Additionally, improving activation rates by 25% can result in a 34% increase in monthly recurring revenue over a year [4]. Speeding up activation is key to turning initial interest into lasting engagement. As Monetizely aptly states:
"In SaaS, value recognized quickly becomes value paid for regularly" [25].
Delivering that first meaningful experience quickly is critical to reducing early drop-offs.
Ease of Measurement and Tracking
Interestingly, while 86% of SaaS companies have defined what counts as an "activation event", only 41% actively measure how long it takes users to reach that milestone [25]. To get an accurate picture, track the median TTA, as averages can be distorted by outliers [25][5]. Breaking down TTA data by factors like acquisition channel, user persona, or subscription plan can reveal which segments struggle to find value. Typically, consumer SaaS products see activation within 1–3 days, SMB-targeted solutions average 7 days, and B2B enterprise tools take about 14 days [25].
Actionability for Improving User Engagement
Reducing TTA involves removing obstacles between signup and the first moment of value. For example, DocuSign cut its TTA by 60% by simplifying its onboarding process from seven steps to three. Dropbox reduced TTA by 30% by encouraging users to upload their first file, which also increased conversion rates by 10% [25]. Similarly, Notion boosted activation rates by 25% by introducing templates that helped users avoid the daunting "blank slate" experience. Interactive guidance also proves effective - Intercom found that users completing an interactive product tour activated 30% faster [25]. The key is to eliminate unnecessary steps and guide users toward their first success as quickly as possible [25][26].
7. Account Activation Rate
Account Activation Rate measures the percentage of new accounts that reach a defined "aha moment", signaling the shift from simply signing up to actively engaging with your product [8][6]. As discussed with Activation Rate and other KPIs, this metric is the vital link between acquiring customers and keeping them for the long haul. Without activation, the money spent on acquisition loses its value [8][6]. Activation is a key indicator of whether a user will transition to a paid plan or churn early [10]. Unlike other activation metrics, this one directly ties early engagement to long-term retention and revenue, offering a unique angle on user success.
Impact on Customer Activation
The average user activation rate for SaaS companies hovers around 37.5% [4]. The stakes are high - 95% of new users abandon an app within 90 days, with most leaving before they even activate [6]. Andrew Chen, General Partner at Andreessen Horowitz, explains it well:
"The companies that win are the ones that solve for activation, not just acquisition." [6]
Benchmarks differ depending on the product: consumer apps often hit activation rates of 60% or more, SaaS products aimed at SMBs average around 40%, and enterprise solutions typically see about 25%+ [6].
Ease of Measurement and Tracking
Tracking this metric requires looking beyond individual actions to assess overall account engagement. Start by identifying the actions that best predict long-term retention. For example, Slack's user-level activation metric was defined as sending 2,000 messages, but at the account level, activation involved entire teams adopting core collaboration features [6]. Use funnels to map the user journey and pinpoint where accounts drop off [8][4]. It's crucial to track activation within a set timeframe - this could be 24 hours for simple apps or 7–14 days for more complex B2B tools [8][6]. Segment data by acquisition channel, user persona, or company size to identify groups that struggle [5][4]. Finally, compare retention rates between accounts that activated and those that didn’t to validate the metric’s importance [8][6].
Actionability for Improving User Engagement
Practical examples show how focusing on activation can drive results. Clearcalcs, a structural design platform, introduced welcome surveys to gather customer data and customize onboarding for different segments, improving activation rates across the board [4]. The Room, a talent connection platform, used interactive walkthroughs to guide users through key features, leading to a 75% increase in activation within just 10 days [4].
To improve activation, simplify your signup process by reducing required fields or adding social login options [8][4]. Use behavior-based triggers to send automated emails or in-app nudges when accounts stall at specific steps [13][5]. Interactive walkthroughs, complete with tooltips and modals, can also guide users in real time [13][4]. This metric wraps up the activation KPI suite, highlighting the importance of measuring every stage of customer engagement.
Conclusion
Understanding and leveraging these KPIs is essential for turning trial signups into engaged, paying customers. The seven key customer activation metrics - Activation Rate, Visitor-to-Signup Rate, Signup-to-Subscriber Rate, DAU to MAU Ratio, Feature Adoption Rate, Time to Activation, and Account Activation Rate - offer a clear lens into user engagement. They pinpoint the moments when users either find value or drop off, acting as early indicators of long-term success [2].
The data paints a clear picture: 90% of trial users never reach activation, and 95% of new users abandon within 90 days. But here’s the opportunity - boosting activation rates by just 25% can lead to a 34% increase in monthly recurring revenue over 12 months [2][4][6]. Additionally, users who hit their first “aha moment” quickly are 300% more likely to stick around long-term, while activated users are retained at 3–7 times the rate of non-activated users after 60 days [2][6].
These numbers highlight both the challenges and the potential for growth. Anthony Martin, CEO of Choice Mutual, emphasizes the importance of consistent tracking:
"We check in with these metrics on a monthly basis: this ensures the marketing and customer service policies we implement are staying on track, but also allows enough time to give new ideas and strategies a chance to develop" [3].
To move forward, define the "aha moment" for each user persona and monitor all seven KPIs. Identify where users are dropping off and run targeted experiments to reduce friction. Segment your data by acquisition channel and persona to uncover specific pain points. Then, combine these metrics with qualitative tools like session replays and user feedback to understand why users behave the way they do.
Focus on shrinking Time to Value - top-performing SaaS products achieve this in under 24 hours [2]. Use progressive onboarding to guide users toward core features without overwhelming them.
Tracking these activation metrics bridges the gap between acquisition efforts and sustainable growth. Start today, and you’ll gain the insights needed to convert more trial users into loyal customers.
FAQs
::: faq
How do I define my product’s “aha moment”?
To pinpoint your product's "aha moment", focus on identifying a measurable action that signals a user has grasped your product's main value and is likely to remain engaged over time. This isn't about a vague feeling - it’s about specific behaviors, like completing crucial onboarding steps. By analyzing user behavior, you can uncover milestones closely linked to retention. From there, you can refine the user experience to steer people toward that key action. :::
::: faq
What’s the best time window to measure activation?
The best time to measure activation is within the first week after signup. Why? Users who don’t activate during this period are much more likely to churn. Keeping the activation window short also boosts ROI and speeds up product feedback cycles, allowing teams to make quick adjustments where needed. :::
::: faq
Which activation KPI should I prioritize first?
To get started, focus on the Activation Rate - this represents the percentage of new users who experience your product's core value or hit that "aha" moment. Why does this matter? Because it's key to building long-term user engagement and retention. Think of it as the cornerstone for improving how effectively customers get activated. :::
Related reading
- Feature Flagging Software With Experimentation Analytics (2026)
- Time to Value (TTV): How the Best SaaS Companies Measure and Reduce It
- User Activation Rate: How to Find and Fix Your SaaS Aha Moment
- The SaaS Monetization Audit: Are You Leaving Revenue on the Table
- SaaS Time to Value Benchmarks 2026: Average TTV by Category
Useful tools & services
Go deeper than any blog post.
The full system behind these articles—frameworks, diagnostics, and playbooks delivered to your inbox.
No spam. Unsubscribe anytime.