SaaS CAC Payback Period Benchmarks 2026 by Industry
SaaS CAC payback period benchmarks for 2026 by stage, ACV, and industry. See typical ranges, red flags, and levers that shorten payback.
The CAC payback period shows how long it takes for a SaaS company to recover customer acquisition costs (CAC) through gross-margin-adjusted revenue. It’s a critical metric for understanding capital efficiency and growth potential in SaaS businesses.
Key Takeaways:
- B2B SaaS companies typically recover CAC in 15 months, while B2C SaaS averages 4.2 months.
- Payback periods vary by company stage, deal size (ACV), and industry vertical:
- Seed/Series A: <12 months preferred; Late Stage/Pre-IPO: Up to 24 months is acceptable.
- Low-touch deals (<$5K ACV): 6–12 months; Enterprise deals (>$100K ACV): 18–24 months.
- Marketing SaaS leads with a 7.8-month median payback, while HR platforms average 10.6 months.
- Red flags: Payback exceeding 60% of customer lifetime or rising for 3+ quarters suggests inefficiencies.
- Shorter payback periods (<12 months) enable faster reinvestment but may indicate underinvestment in growth. Longer periods (>18 months) are viable for enterprise models with strong retention.
Formula for Payback Period:
CAC ÷ (Monthly ARPU × Gross Margin%)
Understanding and optimizing your payback period is essential for scaling efficiently, securing funding, and ensuring sustainable growth. Model payback alongside MRR and churn in a SaaS growth model spreadsheet.
::: @figure 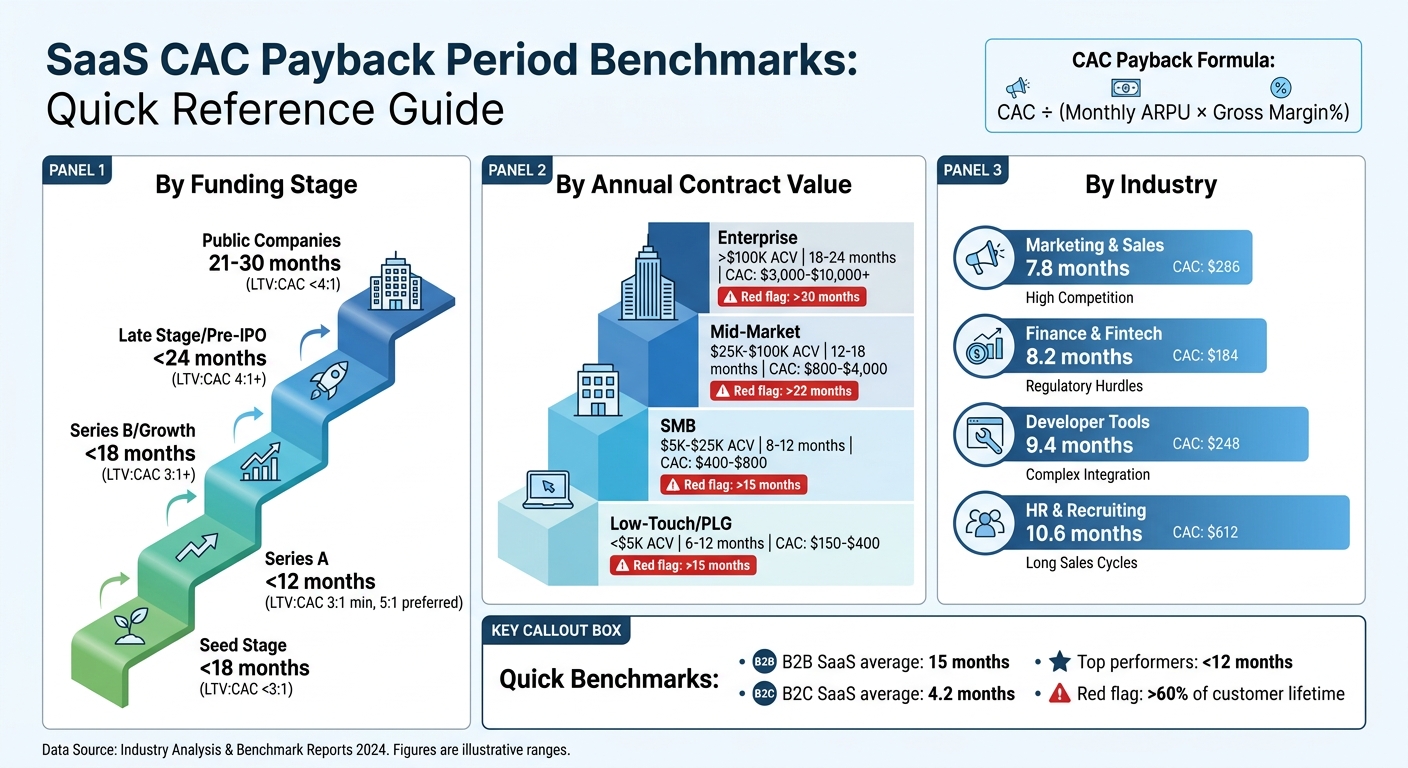 :::
:::
What Do You Mean by a Gross Margin Adjusted CAC Payback? | SaaS Metrics School | The SaaS CFO
::: @iframe https://www.youtube.com/embed/-mk1Ktlr-qo :::
sbb-itb-0499eb9
1. Payback Period by Company Stage
The stage your company is in plays a big role in shaping investor expectations for your CAC (Customer Acquisition Cost) payback period. Early-stage businesses often benefit from founder-led sales and enthusiastic early adopters, which keep costs low and allow for quicker payback. However, as companies grow, they tend to invest more heavily in paid acquisition channels and enterprise sales strategies, which can stretch out the payback period [3].
For instance, companies generating $1,000–$10,000 in monthly recurring revenue (MRR) typically experience a median payback period of about 4.8 months. This increases to around 6.4 months for businesses earning $10,000–$50,000 in MRR, 7.2 months for those with $50,000–$200,000 in MRR, and 8.8 months for companies with over $200,000 in MRR [3].
These shifts highlight how scaling impacts payback expectations. Investors adjust their benchmarks as companies grow. For Seed and Series A companies, investors generally look for a payback period under 12 months. By Series B, this can extend to about 18 months as businesses refine scalable channels. Late-stage or pre-IPO companies may operate with payback periods of up to 24 months, as long as their Net Revenue Retention exceeds 120%. Public SaaS companies, on the other hand, often have payback periods ranging from 21 to 30 months [3][5].
| Funding Stage | Desired Payback Period | LTV:CAC Target |
|---|---|---|
| Seed | <18 months | <3:1 acceptable |
| Series A | <12 months | 3:1 minimum; 5:1 preferred |
| Series B / Growth | <18 months | 3:1+ (improving) |
| Late Stage / Pre-IPO | <24 months | 4:1+ at scale |
| Public Companies | 21–30 months | Varies by segment |
"If your payback period is increasing as you scale, your unit economics are deteriorating." – Bradley Jones, Founder, Foundry CRO [5]
It's important to watch for warning signs. For example, if your payback period rises for three consecutive quarters, it could point to structural inefficiencies in your growth strategy. On the flip side, an extremely short payback period - less than three months - might suggest you're not investing enough in growth, potentially leaving market share on the table [3].
2. Payback Period by Deal Size (ACV)
Your Annual Contract Value (ACV) plays a big role in shaping how long investors expect you to recover your acquisition costs. Let’s break it down by deal size:
Low-touch deals under $5,000 typically need a payback period of 6 to 12 months, with Customer Acquisition Costs (CAC) ranging from $150 to $400. These deals, often tied to self-serve or Product-Led Growth (PLG) models, face high churn rates. For instance, if recovery takes 18 months, but the average SMB churns after 14 months, you’re losing money on every deal[7].
Mid-market deals, with ACVs between $25,000 and $100,000, face what’s often called the "mid-market squeeze." These deals require more effort, such as inside sales teams, product demos, and negotiations. CAC for this segment typically runs between $800 and $4,000, with payback periods of 12 to 18 months. If your payback stretches beyond 22 months, it’s a warning sign[5].
Enterprise contracts over $100,000 have longer payback periods, typically 18 to 24 months, but they’re backed by advantages like high switching costs, lower churn rates, and strong potential for expansion. CAC here ranges from $3,000 to over $10,000. These economics make sense when your Net Revenue Retention (NRR) exceeds 115% and your average customer lifetime is over five years[3].
"A 2.5:1 ratio with 8-month payback (SMB PLG) is healthier than a 4:1 ratio with 24-month payback (enterprise) for a cash-constrained startup." – Bradley Jones, Founder, Foundry CRO[5]
| Segment | ACV Range | Target Payback | Red Flag Threshold | Typical CAC |
|---|---|---|---|---|
| Low-Touch / PLG | < $5,000 | 6–12 months | > 15 months | $150 – $400 |
| SMB | $5,000 – $25,000 | 8–12 months | > 15 months | $400 – $800 |
| Mid-Market | $25,000 – $100,000 | 12–18 months | > 22 months | $800 – $4,000 |
| Enterprise | > $100,000 | 18–24 months | > 30 months | $3,000 – $10,000+ |
One common misstep is using raw Monthly Recurring Revenue (MRR) instead of gross-margin-adjusted revenue to calculate payback. This approach can underestimate your actual recovery time by 15% to 40%, as it doesn’t account for the cost of service delivery[3][7]. To get a clear picture, always use the formula:
CAC ÷ (Monthly ARPU × Gross Margin %).
This breakdown by deal size builds on earlier discussions around company stages and sets the foundation for diving into industry-specific benchmarks next.
3. Payback Period by Industry
Industry-specific data adds another layer of precision to your financial planning, complementing benchmarks based on company stage and deal size.
Your industry plays a significant role in determining how quickly you recover customer acquisition costs (CAC). Marketing & Sales SaaS companies lead the pack with a median payback period of 7.8 months and a typical CAC of $286. However, these companies often face challenges in highly competitive paid channels. With CPCs rising across 87% of industries as of 2025, acquisition costs remain high[5].
Finance & Fintech tools come next, with a median payback period of 8.2 months. These businesses often deal with longer sales cycles due to strict compliance requirements and the need to build trust when handling sensitive financial information[3].
Developer Tools have a median payback period of 9.4 months and a CAC of $248. While bottom-up adoption can reduce initial acquisition costs, converting individual developers into enterprise-level customers takes more time[3].
On the other hand, HR & Recruiting platforms experience the longest payback period at 10.6 months, coupled with the highest CAC of $612. The extended timeline is attributed to high-touch sales processes and decision cycles that involve multiple stakeholders and lengthy procurement reviews[3].
"Shorter payback enables faster reinvestment into growth."
It's crucial to avoid comparing your payback period directly to industry averages without factoring in your ACV (Annual Contract Value) tier. For example, an 18-month payback period for a mid-market HR tool could indicate strong performance, while a low-cost marketing tool with a 15-month payback might signal inefficiency. Always benchmark against companies within your vertical and deal size category to assess performance accurately[3].
| Vertical | Median Payback | Typical CAC | Primary Challenge |
|---|---|---|---|
| Marketing & Sales | 7.8 months | $286 | Competitive paid channels inflate costs |
| Finance & Fintech | 8.2 months | $184 | Compliance and trust-building extend cycles |
| Developer Tools | 9.4 months | $248 | Bottom-up to enterprise conversion lag |
| HR & Recruiting | 10.6 months | $612 | High-touch sales and multi-stakeholder decisions |
These industry benchmarks, when combined with insights on company stage and deal size, provide a clearer picture of how to refine your SaaS growth strategy. Tailoring your approach to both your vertical and deal size will help determine the true efficiency of your payback period.
Trade-offs: Short vs. Long Payback Periods
Your payback period isn't just a number - it's a critical choice that influences your growth trajectory, capital requirements, and risk tolerance.
Short payback periods (under 12 months) offer speed and adaptability. For instance, a company with a 6-month payback can reinvest its capital twice as quickly as one with a 12-month payback[3]. This faster reinvestment cycle often leads to tangible outcomes: businesses with payback periods under 12 months tend to grow revenue 30–40% faster than those with payback periods of 24 months or more[8]. Additionally, shorter payback periods reduce exposure to market volatility, customer churn, or economic downturns since investments are recouped quickly.
That said, payback periods shorter than 3 months might signal underinvestment in growth. If you're recovering costs too quickly, you could be missing opportunities to scale through channels or strategies that require more upfront spending. This could leave room for competitors to capture market share, as noted in earlier comparisons of industry trends and deal sizes[3].
Long payback periods (18–24+ months) are more common in enterprise SaaS, where large contract values justify the extended timeline. These models are viable when churn is low and expansion revenue is strong. For example, a company with an 18-month payback period can effectively operate with 10-month economics if its net revenue retention (NRR) exceeds 120%[8]. However, this approach demands substantial cash reserves or external funding to bridge the gap, and it carries significant risk if customers churn before you break even.
| Feature | Short Payback (<12 Months) | Long Payback (18+ Months) |
|---|---|---|
| Cash Flow Impact | High liquidity; capital is quickly available for reinvestment[3][4] | Requires significant funding or reserves to sustain operations[3][4] |
| Growth Speed | Enables rapid, self-funded growth[3] | Slower growth due to longer cost recovery times[3] |
| Business Risk | Lower risk; less dependent on long-term retention[3] | Higher risk; reliant on retention and expansion (NRR >120%)[3][5] |
| Ideal Segment | B2C, PLG, SMB (Self-serve)[8][2] | Enterprise, Mid-Market (Field Sales)[7][9] |
The right payback strategy depends on your business model and target audience. SMBs and product-led growth models benefit from faster payback periods to counter higher churn rates, while enterprise businesses can manage longer timelines if they have confidence in customer retention and expansion revenue. A critical benchmark to keep in mind: if your payback period exceeds 60% of the average customer lifetime, your unit economics likely need reevaluation[3]. Balancing these trade-offs is a key part of optimizing your SaaS growth strategy.
Conclusion
Your payback period reveals how quickly your acquisition costs turn into revenue that supports growth. The benchmarks are straightforward: most B2B SaaS companies recover their CAC in 15 to 18 months, while the top performers do so in under 12 months [1][8]. But these numbers only matter when viewed in context. For instance, a 10-month payback period might be fine for an SMB product with a $5,000 annual contract value but could signal trouble for an enterprise deal worth $150,000.
To make the most of these benchmarks, start by calculating your payback period with this formula: CAC ÷ (Monthly ARPU × Gross Margin%) [7]. Skipping gross margin in your calculation will give you an overly optimistic estimate. Next, break down your analysis by customer segments - SMB, Mid-Market, and Enterprise. Mixing these groups together can hide inefficiencies [8]. Keep in mind, if your payback period is longer than 60% of your average customer lifetime, your unit economics might be in trouble [3].
Improving CAC efficiency starts with conversion rate optimization. Since ad platforms largely control cost-per-click, improving your landing page conversion rate by just 1.5 percentage points can reduce CAC by 33% [5]. Fixing outbound data quality issues is another must - bad contact data can inflate CAC by 30–40% [6]. Redirecting resources to lower-cost channels, like inbound marketing and partnerships, can also make a big impact. These channels often deliver CAC that’s 30% to 60% lower than paid acquisition [6]. Additionally, building up organic SEO early on can create a "CAC shield" over time, helping to counteract rising paid acquisition costs [5].
"If your payback period is creeping past 18 months and you're not selling six-figure enterprise contracts, something's broken in your funnel." - Prospeo Team [6]
How to Shorten CAC Payback Without Killing Growth
Payback is not only a finance metric—it is a growth constraint. Long payback freezes hiring and paid acquisition even when LTV looks fine.
| Lever | Moves payback by… | Watch-outs |
|---|---|---|
| Raise ARPU (packaging, annual, usage) | Higher numerator revenue per month | Conversion drop at higher prices |
| Cut CAC (channel mix, conversion) | Lower acquisition cost | Cutting brand channels that feed pipeline later |
| Lift gross margin | More of each dollar recovers CAC | Support costs creep with PLG scale |
| Collect cash earlier (annual prepay) | Instant payback optics + cash | Discount economics |
| Reduce early churn | More months of contribution | Activation and onboarding first |
Worked example
- CAC = $2,400
- ARPU = $200/mo
- Gross margin = 80%
- Monthly contribution = $160
- Payback = 15 months
If packaging lifts ARPU 20% to $240 (contribution $192), payback falls to 12.5 months. If activation work cuts effective CAC 15% via higher signup→paid (same ad spend, more customers), payback falls further. Stack both and you often clear the <12-month "investable growth" band investors like for PLG.
Model this live with a SaaS growth model spreadsheet and unit-economics tools on our calculators hub.
FAQs
::: faq
What costs should be included in CAC?
CAC, or Customer Acquisition Cost, should account for all sales and marketing expenses directly linked to acquiring new customers. This includes spending on advertising, sales team salaries, sales tools, events, and promotional activities. However, it’s important to leave out costs like SDR (Sales Development Representative) salaries, sales tools, or event expenses that could artificially reduce payback periods. :::
::: faq
How do I calculate payback for SMB vs. enterprise separately?
To figure out the payback period for both SMB and enterprise segments, apply this formula: CAC Payback Period = CAC ÷ (Monthly ARPU × Gross Margin %). For SMBs, the typical payback period ranges from 8 to 12 months, whereas enterprises usually take 18 to 24 months. These median benchmarks provide a way to assess performance and gauge how quickly each segment recovers its customer acquisition costs. Generally, SMBs recover these costs faster than enterprise customers. :::
::: faq
What are the fastest ways to shorten my payback period?
To shorten your SaaS payback period, the goal is to lower customer acquisition costs (CAC) while boosting the revenue you earn from each customer. Here are some ways to make that happen:
- Leverage cost-effective channels: Referrals and organic growth are much cheaper than pouring money into paid ads. Focus on these to keep CAC low.
- Cut unnecessary spending: Evaluate your sales and marketing budgets for areas to trim without sacrificing results.
- Increase customer value: Look into ways to upsell or cross-sell to existing customers or improve your gross margin.
- Focus on smaller markets: Serving SMBs often leads to quicker payback periods compared to working with larger, slower-moving enterprise clients.
By combining these strategies, you can make progress toward a shorter payback period. :::
Related reading
- Zuora vs Stripe vs Orb (2026): Usage-Based Billing for SaaS
- Usage-Based Pricing for SaaS: When It Works and When It Backfires
- what pricing models should i expect from ai-driven bi platforms that track real-time product metrics?
- Should You Add Enterprise Pricing? A Revenue-Impact Calculator for SaaS
- How to Price Your SaaS Product When You Have No Competitor Data
Useful tools & services
Go deeper than any blog post.
The full system behind these articles—frameworks, diagnostics, and playbooks delivered to your inbox.
No spam. Unsubscribe anytime.