SaaS Growth Model Spreadsheet Template (Free): MRR, Churn, CAC & LTV
Free SaaS growth model spreadsheet: forecast MRR, churn, CAC, and LTV month by month, run scenarios, and pressure-test your growth plan before you spend.
Running a SaaS business without a growth model is like navigating without a map - you risk making costly missteps. A growth model helps you plan for key decisions, like when to hire, how much to spend on marketing, and whether you have enough cash to reach profitability. The best part? You can create one using just a spreadsheet.
Here’s what you’ll learn:
- Key data to collect: MRR, churn rates, lead conversions, ARPU, and costs like salaries and infrastructure.
- Revenue forecasting: Step-by-step formulas for calculating New MRR, Churned MRR, and Expansion MRR.
- Cost planning: Budgeting for headcount, marketing, and operational expenses.
- Key metrics: LTV:CAC ratio, payback period, and burn rate.
- Scenario modeling: Test base, optimistic, and pessimistic cases to prepare for different outcomes.
The article also includes a free, pre-built spreadsheet template to simplify the process. Input your data, adjust variables, and instantly see the impact on your growth projections. By regularly updating your model, you’ll stay on top of your cash flow and make informed, data-driven decisions.
How To Create A SaaS Revenue Forecast Model In Excel

::: @iframe https://www.youtube.com/embed/pSz38L6dz1Y :::
sbb-itb-0499eb9
What Data You Need to Start Your Growth Model
Before diving into your forecast, it's crucial to have all your baseline data ready. A growth model is only as good as the information you feed it. As Ruben Dominguez from The VC Corner explains:
"A model is only as useful as it is grounded. By anchoring your SaaS forecast in actuals, you avoid magical thinking and set more realistic expectations." [3]
To build a reliable forecast, start with Month 0 actuals - your current customer count, Monthly Recurring Revenue (MRR), and historical churn rates. This ensures your projections are based on reality, not guesswork. Even small errors can snowball. For instance, underestimating monthly churn by just 2% (e.g., 2% instead of 4%) could shrink your projected runway from 18 months to just 11 [3].
Core Data Points to Collect
To get started, focus on collecting these key data points:
-
MRR Build Components: This includes Starting MRR, New MRR from customer acquisition, Churned MRR from lost customers, and Expansion MRR from upgrades or upsells [7]. Together, these metrics provide a complete picture of your monthly revenue shifts.
-
Funnel Metrics: Gather data such as lead-to-close conversion rates, sign-up to paid conversion percentages, and Average Revenue Per User (ARPU). Don’t forget your Customer Acquisition Cost (CAC), which is your total sales and marketing spend divided by the number of new customers.
-
Headcount Plan: Include salaries by role and use a 1.3x multiplier to account for benefits and taxes [1]. For example, if an engineer’s base salary is $100,000.00 annually, budget $130,000.00 total.
-
Infrastructure Costs: Factor in hosting (often around $1,200.00/month for early-stage companies), marketing spend (typically $5,000.00/month for paid ads), and General & Administrative (G&A) expenses like rent and legal fees [3].
Make sure to record this data monthly to capture churn and cash flow accurately [7]. Also, update your actuals every month to keep your model aligned with current realities rather than outdated assumptions [2].
Revenue and Cost Drivers
Once you’ve gathered your data, your growth model should balance revenue and cost drivers. These inputs ensure your forecast reflects both opportunities and challenges.
Revenue drivers include:
- New customer acquisition (leads multiplied by conversion rates)
- Expansion revenue from upsells or adding seats
- Retention efforts to minimize churn
Your pricing strategy also plays a significant role. For instance, whether you charge $150.00 per user or offer tiered pricing plans will directly impact MRR growth [3]. Additionally, tracking Net Revenue Retention (NRR) is essential - an NRR above 100% means your existing customers are driving growth even without new acquisitions [8].
Cost drivers fall into three main categories:
- Headcount: Often your largest expense, averaging around $8,500.00 per month per employee when factoring in benefits and commissions [3].
- Marketing Spend: Includes paid ads, events, and content creation, which directly influence your CAC.
- COGS (Cost of Goods Sold): Covers hosting, CDN services, and support tools needed to deliver your product. Aim for a gross margin of 70% or higher [1].
Here’s a quick breakdown of how these drivers interact:
| Revenue Drivers (Growth) | Cost Drivers (Burn) |
|---|---|
| New MRR from acquired customers | CAC from sales and marketing spend |
| Expansion MRR from upsells/seats | COGS for hosting and infrastructure |
| Retention efforts reducing churn | Headcount costs (salaries + benefits) |
| Pricing strategy and ARPU increases | G&A expenses like rent and legal fees |
To simplify scenario testing later, centralize these inputs in an "Assumptions" sheet [1]. This allows you to tweak variables - like increasing churn by 2% or cutting CAC by 10% - and immediately see how these changes affect your forecast.
How to Build Your SaaS Revenue Forecast
::: @figure 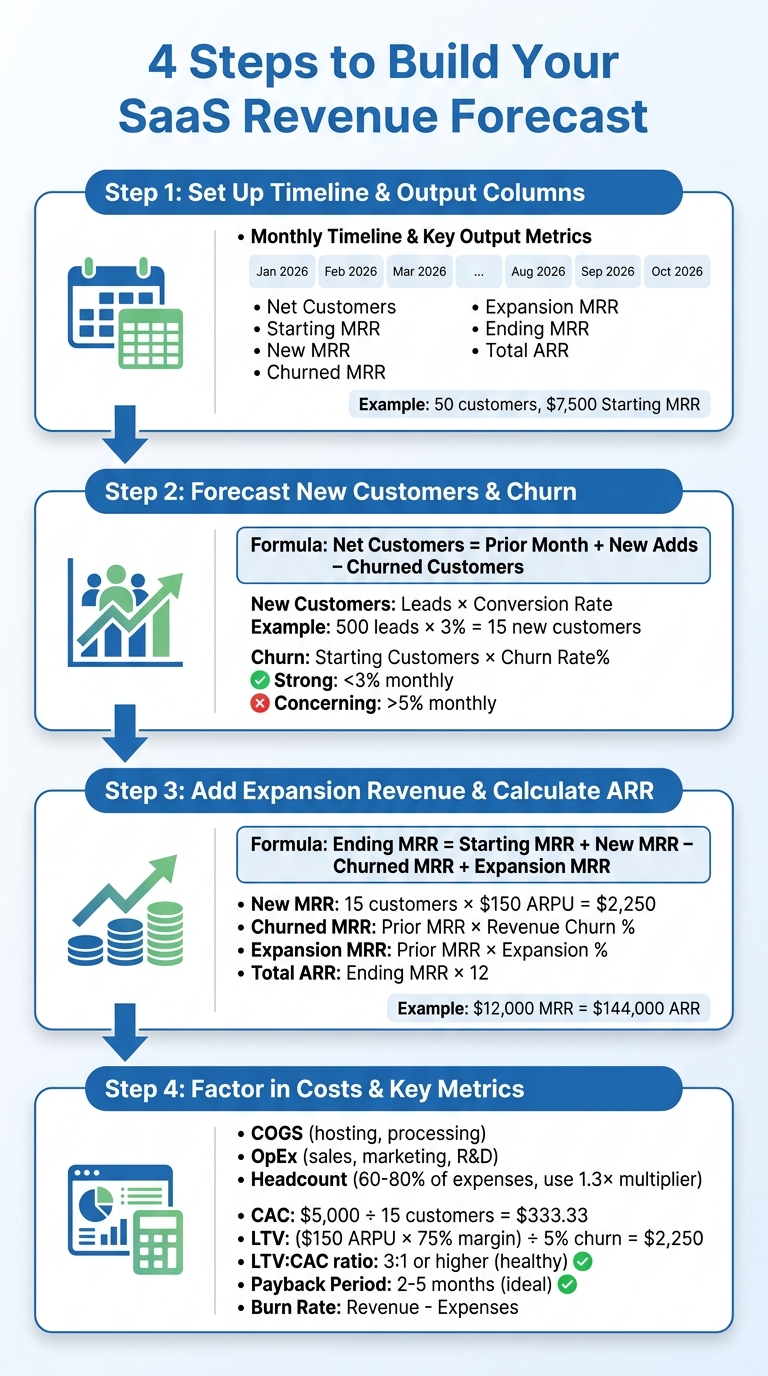 :::
:::
Once you’ve gathered your baseline data, it’s time to create your revenue forecast. As Victor Cheng, Founder, points out:
"The Monthly Recurring Revenue (MRR) build is the backbone of your forecast" [7].
This process forms the foundation for a detailed, bottom-up forecast that tracks both customer numbers and revenue on a monthly basis.
Step 1: Set Up Your Timeline and Output Columns
Start by creating a spreadsheet with a monthly timeline across the top row. Label columns as Jan 2026, Feb 2026, Mar 2026, and so on. Using monthly intervals - rather than annual - lets you account for churn and changes in customer acquisition more precisely.
Key output metrics to include:
- Net Customers (total active customer count)
- Starting MRR
- New MRR
- Churned MRR
- Expansion MRR
- Ending MRR
- Total ARR
This setup gives you a clear picture of how revenue evolves month by month. For example, January 2026 might show 50 net customers and $7,500.00 in Starting MRR, with future months calculated using the formulas outlined below.
Step 2: Forecast New Customers and Churn
To calculate net customer growth, use the formula:
Net Customers = Prior Month + New Adds – Churned Customers
This bottom-up method (Customers × Price) is more reliable than relying on top-down market share estimates.
- New Customers: Estimate these using a marketing funnel (Leads × Conversion Rate) or a fixed growth rate. For instance, converting 3% of 500 monthly leads results in 15 new customers.
- Churn: Compute churn as Starting Customers × Churn Rate%. The Foundra Editorial Team emphasizes:
"If you're not including churn, your projections are fantasy" [9].
A monthly churn rate below 3% is generally strong, while rates over 5% may raise concerns. For low-touch SaaS products, a churn rate of around 2% suggests a loyal user base, whereas rates above 10% can signal trouble.
Once customer numbers are in place, you can move on to projecting revenue.
Step 3: Add Expansion Revenue and Calculate Total ARR
With customer counts forecasted, calculate your MRR components using this formula:
Ending MRR = Starting MRR + New MRR – Churned MRR + Expansion MRR
- New MRR: Multiply new customers by Average Revenue Per User (ARPU). For example, 15 customers at $150.00 ARPU generate $2,250.00 in New MRR.
- Churned MRR: Use Prior Month MRR × Revenue Churn Rate (%).
- Expansion MRR: Compute as Prior Month MRR × Expansion Rate (%).
Here’s a summary of the key MRR formulas:
| MRR Component | Formula |
|---|---|
| Starting MRR | Ending MRR of the previous month |
| New MRR | New Customers × ARPU |
| Churned MRR | Prior Month MRR × Revenue Churn Rate (%) |
| Expansion MRR | Prior Month MRR × Expansion Rate (%) |
| Ending MRR | Starting MRR + New MRR – Churned MRR + Expansion MRR |
| Total ARR | Ending MRR × 12 |
For instance, if your Ending MRR for March 2026 is $12,000.00, your Total ARR would be $144,000.00. Adjust for downgrades by factoring in any Contraction MRR not already included.
Once your revenue forecast is complete, it’s time to account for costs and calculate essential SaaS metrics.
Step 4: Factor in Costs and Key SaaS Metrics
Include expenses in three main categories:
- Cost of Goods Sold (COGS): Covers hosting, payment processing, and similar fees.
- Operating Expenses (OpEx): Includes sales, marketing, R&D, and administrative costs.
- Headcount: Labor costs, typically 60–80% of startup expenses. Use a 1.3× multiplier on base salaries to account for payroll taxes and benefits. For example, a $100,000.00 engineer’s salary would require budgeting $130,000.00 annually, or about $10,833.33 per month.
Next, calculate these key metrics:
- Customer Acquisition Cost (CAC): Divide total sales and marketing expenses by the number of new customers. Spending $5,000.00 to acquire 15 customers results in a CAC of $333.33.
- Lifetime Value (LTV): Use the formula: (ARPU × Gross Margin %) ÷ Churn Rate. With a $150.00 ARPU, 75% gross margin, and 5% churn rate, the LTV comes to $2,250.00. A healthy LTV:CAC ratio is generally 3:1 or higher.
- Payback Period: Calculate this as CAC ÷ (ARPU × Gross Margin %). In the above example, the payback period is about 3 months, well within the ideal range of 2–5 months.
- Burn Rate: Subtract total expenses from revenue to determine your monthly burn. For instance, burning $15,000.00 monthly with $90,000.00 in the bank gives you a 6-month runway.
How to Model Different Scenarios
No single growth model can account for every possibility. By modeling multiple scenarios, you can better anticipate potential outcomes and identify the variables that have the biggest impact on your business. Markets fluctuate, churn rates shift, and sales cycles don’t always follow a predictable path. Preparing for a range of outcomes ensures you're ready to adapt.
Creating Multiple Scenarios
Start by building three distinct scenarios: Base Case, Optimistic Case, and Pessimistic Case.
- Base Case: This should reflect realistic assumptions based on your historical data. It’s what you believe is most likely to happen.
- Optimistic Case: This assumes faster growth - 20–30% better performance, lower churn rates, and shorter sales cycles.
- Pessimistic Case: This accounts for slower growth - 20–30% worse performance, higher churn, and delays in acquiring customers [1][7].
To keep things organized, create separate tabs in your spreadsheet, such as "Model – Base", "Model – Optimistic", and "Model – Pessimistic." Alternatively, you can use an assumptions sheet with a dropdown menu. Functions like CHOOSE() or IF() can pull scenario-specific values based on your selection [1][7].
Here’s an example of how key variables might differ across scenarios:
| Variable | Base Case | Optimistic Case | Pessimistic Case |
|---|---|---|---|
| Monthly Churn | 3% (historical avg) | 1.5% (better retention) | 6% (higher churn) |
| New Customer Growth | 15 customers/month | 18 customers/month (+20%) | 12 customers/month (–20%) |
| ARPU | $150.00 | $180.00 (higher pricing) | $130.00 (discounting) |
| Expansion Rate | 2% monthly | 3% monthly | 1% monthly |
To compare results easily, build a dashboard that shows key outputs - like Total ARR, Net Income, and Cash Runway - side by side for all three scenarios [1].
Testing How Changes Affect Your Forecast
Even small changes in key inputs can have a major impact on your long-term projections. Sensitivity testing helps you identify which variables matter most. Focus on critical factors like churn, ARPU, lead-to-close conversion rates, and expansion rates [2][7].
For instance, reducing monthly churn from 5% to 3% can significantly increase ARR over a year for 100 customers at $150.00 ARPU. Test each variable by adjusting it up or down by 10–20% to see how it affects your outcomes [1].
Victor Cheng, Author and Executive Coach, offers a valuable reminder:
"Your model is only as good as your assumptions - and your discipline in updating them" [7].
Make it a habit to regularly update your model with actual data. This keeps your assumptions accurate and helps you spot trends early, giving you time to adjust your strategy before small issues grow into larger challenges. These scenario tests will lay the groundwork for incorporating the customizable template in the next section.
How to Use the Artisan Strategies Growth Model Template

Streamline your growth modeling process with the Artisan Strategies Growth Model Template, a pre-built tool designed to save you time and effort. Instead of starting from scratch, this template - originally crafted by Chris More, VP of Growth at Brave, and presented at the 2017 Growth Hackers conference - provides a ready-made framework to model user growth over 730 periods (days, weeks, or months). It simplifies the process by automating complex cohort calculations, so you can focus on strategy instead of formulas.
To get started, make a copy of the Google Sheet and save it to your own Drive. Once you’ve done that, enter your data and test different scenarios. The template’s hidden calculation sheets manage the intricate math, freeing you to concentrate on decision-making.
What's Included in the Template
The template is organized with a color-coded system for easy navigation:
- Green sheets: Require your input.
- Red sheets: Display automatically generated outputs.
- Black sheets: Handle background calculations you don’t need to adjust.
Here’s a quick look at the key tabs:
| Sheet Name | Purpose |
|---|---|
| Instructions | Step-by-step guide on using and modifying the model. |
| Model Details | Documents your core assumptions and data sources. |
| Input Acquisition | Input baseline and scenario acquisition metrics. |
| Input Retention | Input baseline and scenario retention metrics. |
| Scenario Configuration | Select specific scenarios to calculate and analyze. |
| Active User Trend | Displays active user trends over time for both baseline and scenarios. |
| Scenario Impact | Shows the ROI and impact of inputs on active user outcomes. |
The model also includes an automated cohort analysis that tracks how different user groups behave over time. Want to explore "what if" scenarios? Simply input percentage improvements in retention or acquisition, and the model will instantly show the resulting impact on growth.
Keep in mind that because the model performs complex calculations, it may take 5–10 minutes to process input changes. You can monitor progress through the Formula Bar in Google Sheets, which will display a calculation indicator.
With this structure in place, you’re ready to adapt the template to meet your specific business needs.
How to Customize the Template for Your Business
Start by personalizing the template’s input tabs to reflect your business data:
- Use the "Input Acquisition" and "Input Retention" sheets to input your baseline metrics based on historical performance.
- In the "Model Details" sheet, define what "acquisition" means for your product (e.g., app installs, registrations, or sign-ups) and document your data sources.
Next, adjust the "Period Names" sheet to replace the generic numeric periods with specific dates like "January 2026" or "Q1 2026." This step makes the Active User Trend outputs more intuitive for stakeholders.
To test different growth scenarios, head to the "Scenario Configuration" tab. For example, if your baseline churn is 3% and you want to model a 50% improvement, enter "+50%" rather than recalculating the new rate manually. The model will do the heavy lifting and show the impact of your changes.
As Chris More puts it:
"This spreadsheet is a growth model that has been created for the Growth community to use to understand how to model a user base over time, size up opportunities, and as a tool at the core of finding sustainable growth." [6]
Once you’ve entered your data, the template will generate outputs in the red sheets, allowing you to compare baseline metrics with different scenarios. This feature helps pinpoint which factors drive the most growth. Be sure to revisit and update the model monthly with actual results to keep your projections grounded in reality.
Conclusion
Creating a SaaS growth model doesn’t require advanced expertise - just a solid understanding of key metrics and how they interact. Begin by organizing your assumptions on a single sheet and applying your MRR formula [7]. Link revenue, costs, and headcount to see how hiring decisions directly affect your cash runway. The real advantage lies in treating the model as a dynamic feedback loop. For example, if churn increases by 1%, you should immediately see its ripple effects on metrics like LTV and cash runway [3]. This interconnected approach turns raw data into practical insights.
As Kevan Lee aptly put it:
"SaaS is just math... we can plug our desired growth into a spreadsheet and see exactly the path to get there" [5].
Your model becomes the nerve center for decision-making. It allows you to test scenarios, like whether reducing churn from 5% to 3% or increasing ARPU by 20% has a bigger impact on your bottom line.
To streamline this process, consider using the Artisan Strategies Growth Model Template. This tool comes with pre-built formulas and automated analysis to jumpstart your efforts. Simply download the template, input your baseline data, and adjust tabs to reflect your SaaS pricing strategy and acquisition channels. By updating it monthly with actual results, you’ll ensure your forecasts remain grounded in reality and avoid overly optimistic projections without historical backing. With this approach, your model evolves into a strategic tool for clear and actionable forecasts.
If your model isn’t influencing decisions around hiring, marketing, or fundraising, it’s just for show [4]. Instead, use it to stress-test strategies, communicate effectively with investors, and make confident, data-driven decisions. Regularly refine your inputs based on real-world outcomes to keep your strategy aligned with reality.
What to Put in Row 1 of a SaaS Growth Model
A useful model is small enough to argue about. Start with these interconnected rows (monthly):
- New customers = paid + organic + sales-sourced
- Starting customers and churned customers (logo or revenue churn—pick one and stay consistent)
- ARPU by segment (PLG vs sales-led if both exist)
- MRR = customers × ARPU (or sum of expansion-aware MRR)
- CAC by channel and blended
- Cash contribution ≈ MRR × gross margin − opex slice you care about
- Payback and LTV:CAC as output metrics, not inputs
Scenario tabs worth running monthly
| Scenario | Shock | Decision it informs |
|---|---|---|
| Base | Current funnel rates | Hiring plan |
| +20% activation | Same traffic, better aha | Onboarding investment |
| −15% paid CAC efficiency | CAC rises | Channel cut or creative reset |
| Price +10% | Conversion −X% | Whether packaging test is worth it |
| Churn −0.5pp monthly | Retention program | CS headcount vs feature work |
If the model cannot answer "what happens if activation rises 5 points?", it is a forecast spreadsheet, not a growth model. Tie conversion inputs to SaaS conversion benchmarks and churn inputs to churn benchmarks.
FAQs
::: faq
How far out should I forecast my SaaS growth model?
When building a SaaS growth model, there’s no one-size-fits-all approach to deciding how far ahead to forecast. However, most financial models typically span 3 to 5 years. This timeframe strikes a balance - it’s long enough to capture important metrics like growth, churn, and revenue trends, yet still detailed enough to support strategic planning and impress investors. A 3-5 year forecast offers a practical mix of precision and a forward-looking perspective. :::
::: faq
What’s the simplest way to model churn if I don’t have much history?
The easiest way to predict churn when you have limited historical data is to start with industry averages or basic assumptions about your customers. For early-stage SaaS businesses, monthly churn rates typically fall between 3% and 7%. You can use this range to estimate cancellations as a percentage of your customer base. As you gather more precise data, you can fine-tune your model to better reflect your business. :::
::: faq
Which assumptions should I change first when scenario testing?
To refine your SaaS growth model, begin by revisiting key assumptions like growth rates, churn rates, and customer acquisition costs (CAC). These metrics play a critical role in shaping your revenue, profitability, and cash flow. By zeroing in on these areas, you can pinpoint which factors have the greatest impact on your model. This approach not only helps you understand the sensitivity of your assumptions but also clarifies how adjustments can influence your overall results. :::
Related reading
- SaaS Marketing Budget Benchmarks 2026
- SaaS Growth Rate Benchmarks 2026
- Zuora vs Stripe vs Orb (2026): Usage-Based Billing for SaaS
- Usage-Based Pricing for SaaS: When It Works and When It Backfires
- what pricing models should i expect from ai-driven bi platforms that track real-time product metrics?
- Should You Add Enterprise Pricing? A Revenue-Impact Calculator for SaaS
- How to Price Your SaaS Product When You Have No Competitor Data
Useful tools & services
Go deeper than any blog post.
The full system behind these articles—frameworks, diagnostics, and playbooks delivered to your inbox.
No spam. Unsubscribe anytime.