How to Diagnose a Leaky SaaS Funnel in Under an Hour
Pinpoint where your SaaS funnel loses users in under an hour and prioritize fixes to boost conversions.
How to Diagnose a Leaky SaaS Funnel in Under an Hour
Think your SaaS funnel is working fine? Here’s a reality check: 79% of leads never convert. A leaky funnel doesn’t just waste your marketing budget - it drains revenue and slows growth. The good news? You can pinpoint the weak spots in under an hour.
Here’s how to do it step-by-step:
- Outline Your Funnel Stages (5 minutes): Define each stage clearly - Awareness, Acquisition, Activation, Retention, Revenue, and Referral. Measure conversion rates at every step.
- Set Up Tracking Tools (10 minutes): Use GA4 or similar tools to track key events like signups, activations, and purchases. Add event tracking to monitor user behavior.
- Find Drop-Off Points (15 minutes): Analyze conversion rates and user paths to see where users leave. Compare against industry benchmarks (e.g., trial-to-activation ~30%).
- Understand Why Users Leave (20 minutes): Use session replays and heatmaps to identify friction - rage clicks, confusing forms, or slow-loading pages.
- Prioritize Fixes (10 minutes): Focus on high-impact areas like activation or pricing page drop-offs. Start with quick, simple fixes for maximum results.
The takeaway: Small, targeted improvements at key stages can boost revenue significantly. Don’t let leaks hold you back - start diagnosing today.
::: @figure 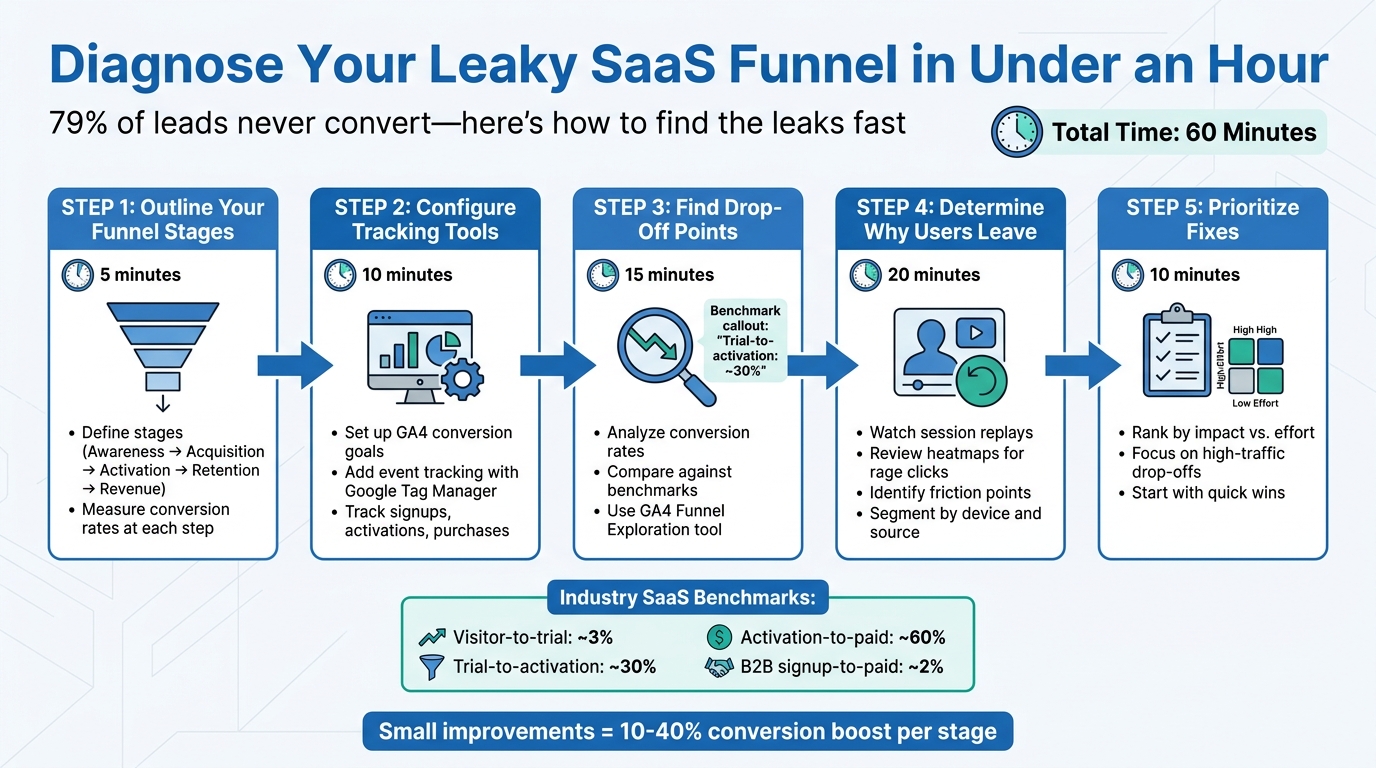 :::
:::
B2B Sales Funnel: How To Optimize It to Boost Conversions
::: @iframe https://www.youtube.com/embed/ZiFjEwSTG74 :::
Step 1: Outline Your Funnel Stages (5 Minutes)
To get started, turn your understanding of the funnel into a clear and actionable framework.
Identify Your Funnel Stages
Start by listing the key stages of your funnel. Common ones include Awareness, Acquisition, Activation, Retention, and Revenue. For B2B setups, you might also include stages like MQL (Marketing Qualified Lead), SQL (Sales Qualified Lead), and Opportunity[3]. Define each stage with a specific, measurable action. For example, Activation could mean a user uploads a document within 48 hours[2].
Qareena Nawaz from Agami Technologies highlights the importance of alignment across teams:
If marketing, product, and sales don't agree on what counts as a signup or activation, your metrics lie. [1]
This shared understanding helps avoid confusion and keeps everyone on the same page[2].
Track Your Current Metrics
Once your stages are defined, measure how your funnel is performing today. Use tools like Google Analytics to pull 90-day conversion data. Record the total number of users at each stage and their conversion rates to the next stage[5].
Here are some industry benchmarks to keep in mind:
- Visitor-to-trial conversion: ~3%
- Trial-to-activation rate: ~30%
- Activation-to-paid rate: ~60%[4]
For B2B SaaS, a signup-to-paid conversion rate of about 2% is typical. However, product-led growth tools with well-optimized onboarding can see rates of 5% or more[1]. By capturing these baseline metrics, you can identify weak points in your funnel and focus on areas with the most potential for improvement.
Step 2: Configure Your Tracking Tools (10 Minutes)
Now that you've outlined your funnel stages, it's time to set up tracking tools to identify where users drop off.
Set Up Conversion Goals
In GA4, navigate to Admin > Events and mark these four key events as conversions: account creation, trial starts, activation (your "aha moment"), and billing information entered [1][8]. For instance, if your activation moment happens when a user uploads their first file, create an event named "first_file_upload" and toggle it as a conversion.
Make sure UTM parameters carry through the entire signup process, and map user identifiers across platforms so you can track visitors from their first ad click to when they become paying customers. Many SaaS companies lose attribution data during these transitions, so don’t skip this step.
Once you've verified these conversion goals, you can move on to tracking more specific user actions.
Add Event Tracking
Use Google Tag Manager to go beyond basic page views and track user behavior in detail. For example, monitor form starts versus form submissions to see if users abandon the signup process because the form feels too long. Tag each step of a multi-step form (e.g., "form_step_1", "form_step_2") to pinpoint exactly where drop-offs occur.
Capture engagement metrics like page scrolls at 25%, 50%, and 75% depth, as well as clicks on specific calls to action. Also, track traffic from AI sources (like chatgpt.com or perplexity.ai) using dedicated UTM parameters - this type of traffic can convert up to 23 times better than traditional organic search [6].
Finally, use GA4's Funnel Exploration tool to visualize the sequence of events and identify the biggest drop-off points. Before moving forward, double-check your reporting dashboard to ensure all new tags are firing correctly.
Step 3: Find Your Biggest Drop-Off Points (15 Minutes)
Now that your tracking tools are set up, it’s time to dig into your funnel data and figure out where users are leaving your journey.
Calculate Stage-by-Stage Conversion Rates
Open GA4's Funnel Exploration tool and select your sequential conversion events. This tool automatically calculates the completion rates between each step, showing both the percentage of users moving forward and those dropping off [9][10].
Pay attention to both percentages and raw numbers. For example, even a 10% drop at a high-traffic stage can result in a noticeable revenue loss. Think of your overall conversion rate as a warning light - it tells you there’s a problem but doesn’t pinpoint where.
Compare your data to SaaS benchmarks to spot underperforming stages. For instance, if your trial-to-activation rate sits at just 15%, that’s a clear sign something’s off.
Enable the elapsed time feature in GA4 to see how long users spend between steps. If you notice spikes in elapsed time, it could point to friction in your process - like a confusing onboarding flow or a slow-loading SaaS pricing page [10][1]. Additionally, break your data down by device and traffic source. Keep in mind that desktop conversion rates are often much higher than mobile (3.4% vs. 2.0%), so looking at aggregate data might hide issues with the mobile experience [9].
Once you’ve identified these conversion trends, you can move on to mapping user paths to uncover more behavioral patterns.
Track User Paths
The next step is to figure out the alternative routes users take when they don’t convert. Use GA4's Path Exploration tool to analyze behaviors that might be disrupting conversions. This can reveal patterns like users repeatedly visiting the pricing page or navigating to help documentation instead of completing their journey [10][9].
Start by focusing on a key event, such as "trial_started." Use the "Explore paths backwards" option to see where converting users came from, or "Explore paths forwards" to track where drop-offs occur.
For a more complete picture, use the "Indirectly followed by" option. This allows you to include intermediate actions between key events, which is especially helpful for understanding user behavior during exploratory free trials [10].
Step 4: Determine Why Users Are Leaving (20 Minutes)
Now that you've pinpointed where users are dropping off, it's time to dig deeper and figure out why. Numbers alone won't give you the full story - this step is about understanding user behavior and identifying the specific pain points causing friction. Tools like session replays and heatmaps can help you uncover these issues.
Watch Session Replays and Review Heatmaps
Session replays let you watch real user interactions, showing exactly where users get stuck or frustrated. Start by filtering replays to focus on sessions where users exited at key drop-off points - like your pricing page or trial signup form. Watching 10–20 recordings can help you spot common patterns while ignoring outliers[12].
Look for signs of frustration, such as:
- Rage clicks: Rapid, repeated clicks on the same element.
- Excessive scrolling: Users endlessly scroll without taking action.
- U-turns: Users quickly navigate back to a previous page.
These behaviors often point to issues like broken links, unclear error messages, or elements that appear clickable but aren’t. As Juan Fernandez, Head of Product at Audiense, notes:
Every small improvement increases conversions around 10 to 20 percent, which is really significant[14].
Heatmaps provide a broader view of user behavior. Click maps can highlight "dead zones" - areas that users ignore - while scroll maps show if users are abandoning the page before reaching your call-to-action (CTA). If your scroll map reveals users dropping off before critical content, consider moving your CTA higher on the page[13].
Here’s a quick guide to interpreting heatmap patterns:
| Heatmap Pattern | User Behavior | What It Means |
|---|---|---|
| The Dead Zone | No clicks or interaction with certain elements | Content may be irrelevant, too long, or poorly designed[13]. |
| Rage Clicks | Repeated clicks on the same element | Likely frustration caused by broken buttons or unclear functionality[13]. |
| The Scroll Cliff | Sudden drop in scrolling activity | Users lose interest, often due to overwhelming text or misplaced content[13]. |
Once you've reviewed user behavior visually, it's time to break down the data further.
Break Down Data by Source and Device
Segmenting your data by traffic source (paid ads, organic search, email, etc.) and device type (mobile vs. desktop) can reveal whether issues are isolated to specific groups or affect all users[11][5].
Mobile users, for instance, often face unique challenges like tiny buttons, hidden menus, or JavaScript errors that don't impact desktop users. Create separate heatmaps for mobile and desktop to identify these differences[13]. If mobile users are dropping off more than desktop users at the same stage, you might have a responsive design or performance issue.
Also, track time-to-complete metrics. If users are idle for 90–120 seconds, it could signal technical delays or unclear instructions[15]. Compare behavior across traffic sources, too - users from paid ads might leave quickly if the landing page doesn't match the ad copy they clicked on.
Step 5: Confirm Your Findings and Decide What to Fix First (10 Minutes)
The final step is all about confirming your findings and deciding which fixes will have the biggest impact. This ensures your efforts are focused on changes that truly matter within your one-hour diagnostic process.
Use Cohort Analysis to Validate Findings
Cohort analysis is a powerful tool to figure out if a funnel problem affects all users or just specific groups. Break your data into segments based on factors like acquisition source (organic vs. paid), device type, pricing plan, or signup date [1][5].
For instance, if users seem to drop off at your pricing page, segment them by traffic source. You might discover that one group converts much better than another. This could point to an issue with your targeting or messaging rather than the pricing page itself [1][5].
You can also compare cohorts over time. A sudden drop in performance often signals a technical issue, like a broken form or tracking error. On the other hand, a gradual decline might hint at market changes or increased competition [5]. Behavioral cohorts - such as comparing users who completed a key action (like using a specific feature) with those who didn’t - can help confirm which steps in your product drive activation [1].
Once you’ve segmented the data, focus on addressing the most impactful problems.
Rank Fixes by Impact
Prioritize areas where you’re losing the most users instead of focusing only on percentage drops [1]. Improvements in key stages, like activation, can have a ripple effect throughout your funnel. For example, boosting activation from 20% to 35% could increase new monthly recurring revenue by 76% - all without spending more on ads [7].
Qareena Nawaz from Agami Technologies emphasizes this point:
A funnel audit is not a one-time project. It is an ongoing practice that helps your team prioritize product work and marketing spend. [1]
To decide what to tackle first, use an impact-versus-effort matrix. Quick fixes with high impact - like clarifying pricing details or repairing a broken billing field - should be addressed immediately [1][5]. Larger projects, such as revamping your onboarding flow, can be scheduled for quarterly planning. Focus on one or two changes that will make the biggest difference now, and save less urgent fixes for later.
Wrapping Up
You've just completed a one-hour diagnostic to pinpoint the leaks in your SaaS funnel. By mapping out the funnel stages, setting up tracking tools, spotting drop-off points, analyzing user behavior, and prioritizing fixes, you now have a clear plan to tackle revenue loss. This actionable plan is your springboard for immediate improvements.
The next step? Take action right away. Even small adjustments, like clarifying your pricing or fixing a broken billing field, can boost conversions by 10% to 40% at specific stages [1]. When combined, these fixes can lead to noticeable revenue growth [1].
Keep in mind that funnel optimization isn’t a one-and-done task - it’s a continuous process that shapes your product and marketing strategies [1]. Use weekly funnel reports and automated alerts to catch new issues before they cause major revenue loss [5].
Start with the quick wins you identified in Step 5. These high-impact, low-effort changes should be addressed immediately. Larger projects, like overhauling your onboarding process, can be slotted into your quarterly plans. The sooner you move from analysis to action, the faster you’ll see improvements in both conversions and monthly recurring revenue.
Your funnel is either fueling growth or draining revenue. Now, you have the tools to take control and make it work for you.
FAQs
::: faq
What’s the fastest way to define “activation” for my product?
Activation is about pinpointing the key action that proves a user has found real value in your product. This could be something like finishing onboarding, setting up a profile, or using a core feature for the first time.
The goal is to focus on a clear, measurable step that most users take early in their journey. Once you identify this activation point, you can track it, improve it, and use it to boost engagement and understand user behavior better. :::
::: faq
Which GA4 events should I track first to find funnel leaks?
To get started, track GA4 events that align with critical points in your SaaS or sales funnel. Pay attention to:
- Page views and session starts to gauge traffic levels and user engagement.
- Conversions, such as sign-ups or onboarding completions, to measure progress toward goals.
- eCommerce events, including 'view_item,' 'add_to_cart,' 'begin_checkout,' and 'purchase,' to follow the customer journey.
These metrics make it easier to spot where users drop off and identify problem areas quickly - often within an hour. :::
::: faq
How do I prioritize fixes without running a bunch of A/B tests?
To quickly identify and fix issues in your SaaS funnel without relying on extensive A/B testing, start by auditing the funnel for the biggest drop-off points. Pay close attention to areas like onboarding or pricing friction, as these often have the greatest influence on conversions. By addressing these critical pain points, you can make meaningful improvements right away, using data to guide your priorities instead of testing countless variations. :::
Go deeper than any blog post.
The full system behind these articles—frameworks, diagnostics, and playbooks delivered to your inbox.
No spam. Unsubscribe anytime.