Feature Flagging Software With Experimentation Analytics (2026)
Compare feature flagging platforms with built-in experimentation analytics—Optimizely-class stats without a separate integration stack.
Most teams do not need Optimizely-class personalization—and they do not want to glue LaunchDarkly flags to a separate stats engine either. They want feature flags + experiment assignment + a real stats engine in one product: CUPED or Bayesian analysis, sequential testing, guardrail metrics, and rollbacks when a release tanks conversion.
This guide compares five platforms that cover that “flags + experiments” middle ground: Statsig, GrowthBook, Split, Mixpanel Experimentation, and Datadog Feature Flags. For pure A/B suite comparison (Optimizely/VWO/Statsig positioning), see Optimizely vs VWO vs Statsig. For a warehouse-native shootout of GrowthBook, Statsig, and Eppo, see GrowthBook vs Statsig vs Eppo. For usage-based pricing at very high MAU, see experimentation platform pricing at scale.
Who this shortlist is for
| You need… | Shortlist first |
|---|---|
| Eng-owned flags + advanced stats without a separate warehouse project | Statsig |
| Warehouse-native analysis, open source, SQL-first culture | GrowthBook |
| Progressive delivery + automatic impact detection / rollback | Split |
| Experimentation on top of existing product analytics events | Mixpanel |
| Flags tied to APM/infra signals (latency, errors) | Datadog |
Quick comparison
| Tool | Analytics depth | Real-time | Targeting | SDKs | Free tier / entry |
|---|---|---|---|---|---|
| Statsig | Built-in stats engine | High | Behavioral + layers | 30+ | Free up to ~2M events/mo |
| GrowthBook | Warehouse-native | Depends on warehouse latency | Advanced + visual editor | Broad | Free self-host |
| Split | Impact-focused | Real-time alerts | Traffic segmentation | Strong | Free up to ~10 seats |
| Mixpanel | Integrated with product analytics | Real-time | Event cohorts | Major platforms | Paid experimentation add-on |
| Datadog | Observability-first | Live telemetry | Advanced segmentation | OpenFeature-friendly | Trial-led |
Rule of thumb: pick the system of record you already trust (warehouse, product analytics, or APM)—then choose the flag tool that sits closest to it.
::: @figure 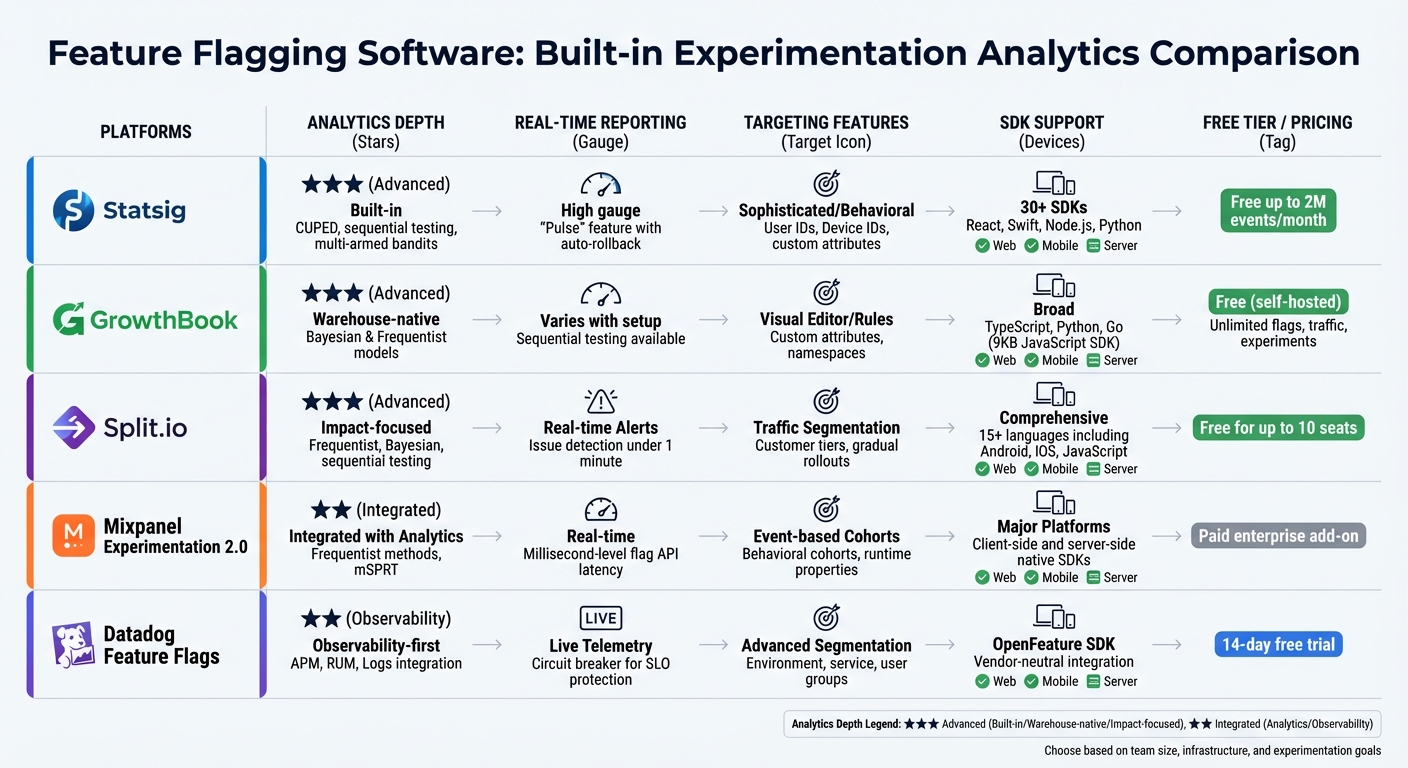 :::
:::
How to Feature Flag and A/B Test with Google Tag Manager and GrowthBook
::: @iframe https://www.youtube.com/embed/PlEpAuQDlIo :::
1. Statsig
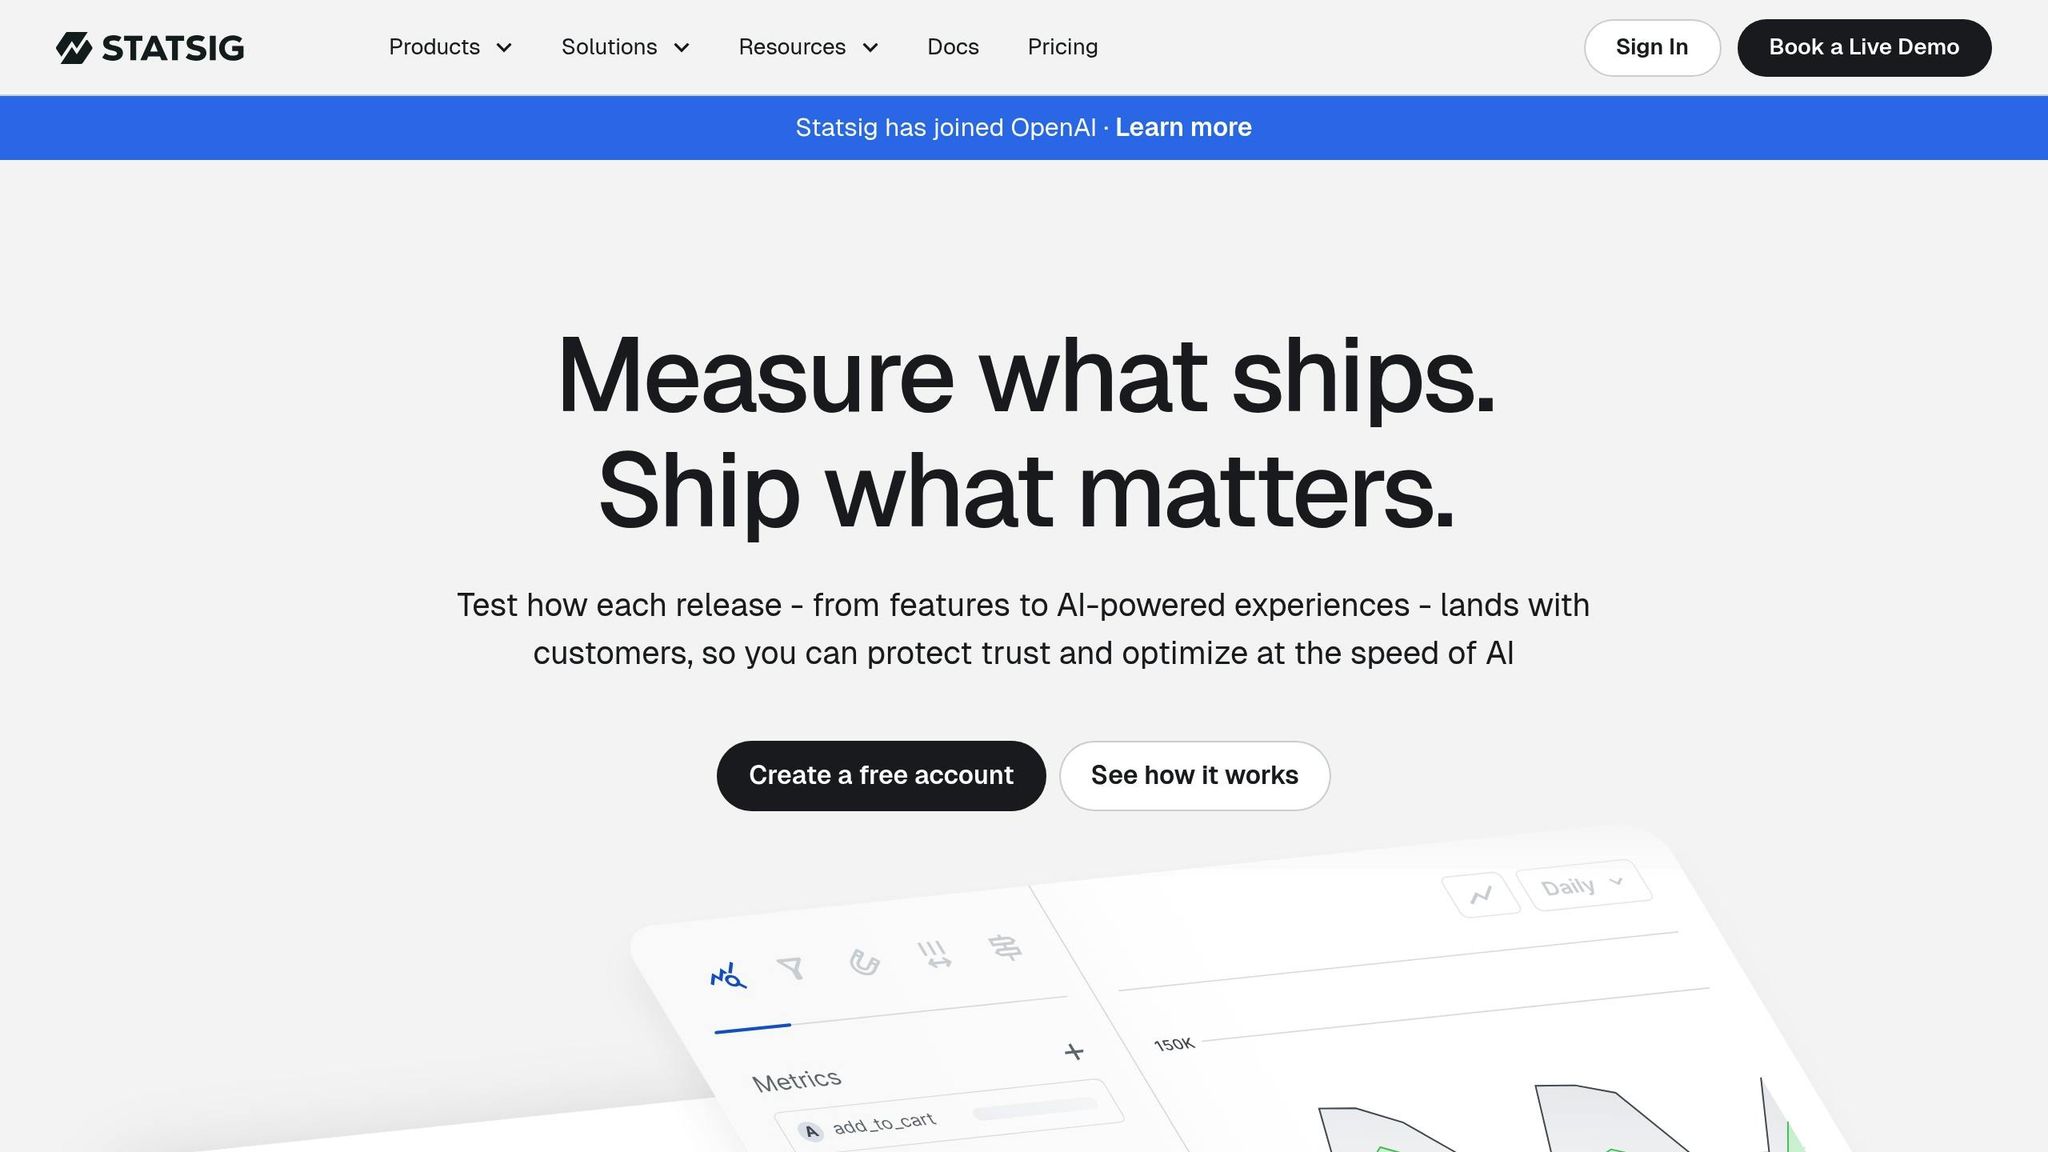
Statsig combines feature flagging with experimentation analytics, offering a comprehensive platform that includes everything from assignment logic to statistical analysis [7]. Below, we’ll explore its standout features, from integrated analytics to real-time monitoring, designed to streamline experimentation workflows.
Built-in Experimentation Analytics
Statsig’s stats engine integrates directly into your workflow, eliminating the need for data transfers thanks to its zero-ETL approach [1][3]. It also includes advanced tools like variance reduction using CUPED, sequential testing, switchback tests, and multi-armed bandits [7].
Don Browning, SVP of Data & Platform Engineering, shared why his team opted for Statsig:
"We evaluated Optimizely, LaunchDarkly, Split, and Eppo, but ultimately selected Statsig due to its comprehensive end-to-end integration. We wanted a complete solution rather than a partial one, including everything from the stats engine to data ingestion." [5]
Over half of Statsig customers increase their experiment volume tenfold within a year [7]. For instance, SoundCloud hit profitability for the first time in its 16-year history in 2024, thanks to Statsig’s platform. By automating manual experiment processes and enabling data-driven feature releases, the company boosted its subscription revenue [7].
Real-Time Insights
Statsig goes beyond integrated analytics by offering real-time operational insights. Its "Pulse" feature monitors exposure events and automatically triggers rollbacks if negative impacts are detected [8][9]. The platform processes trillions of flag checks daily for billions of users, ensuring real-time monitoring of both product metrics and service health [9]. Teams can also search logs, ingest traces with OpenTelemetry, and view live Feature Gate exposures to see which users encounter a specific gate during runtime [8].
Dave Cummings, Engineering Manager at OpenAI, highlighted the platform’s value:
"At OpenAI, we want to iterate as fast as possible. Statsig enables us to grow, scale, and learn efficiently. Integrating experimentation with product analytics and feature flagging has been crucial for quickly understanding and addressing our users' top priorities." [5]
Targeting Options
Statsig offers flexible targeting based on user identifiers, device attributes, and custom attributes [8]. Teams can select randomization units like User IDs, Device IDs, Session IDs, or Custom IDs [4][10]. Deterministic hashing with unique salts ensures consistent user bucketing across sessions and devices [10][11]. Layers allow teams to run multiple experiments simultaneously without interference, maintaining clean results [10]. Scheduled rollouts enable gradual feature deployment, such as scaling from 10% to 20%, while ensuring existing users retain their assigned experiences unless a "resalt" is initiated [8][11]. This precise targeting ensures analytics accurately reflect user impact, supporting data-driven decisions.
SDK and Integration Support
Statsig provides over 30 SDKs, covering a wide range of programming languages [7]. Popular client-side SDKs like React and Swift, as well as server-side options like Node.js and Python, are supported [2][6]. The Statsig Cloud plan includes feature flags and 2 million metered events for free, with additional usage billed based on metered events [1][3]. For enterprise users, the Statsig Warehouse Native option is available through custom contracts and requires a demo with the sales team [1][3].
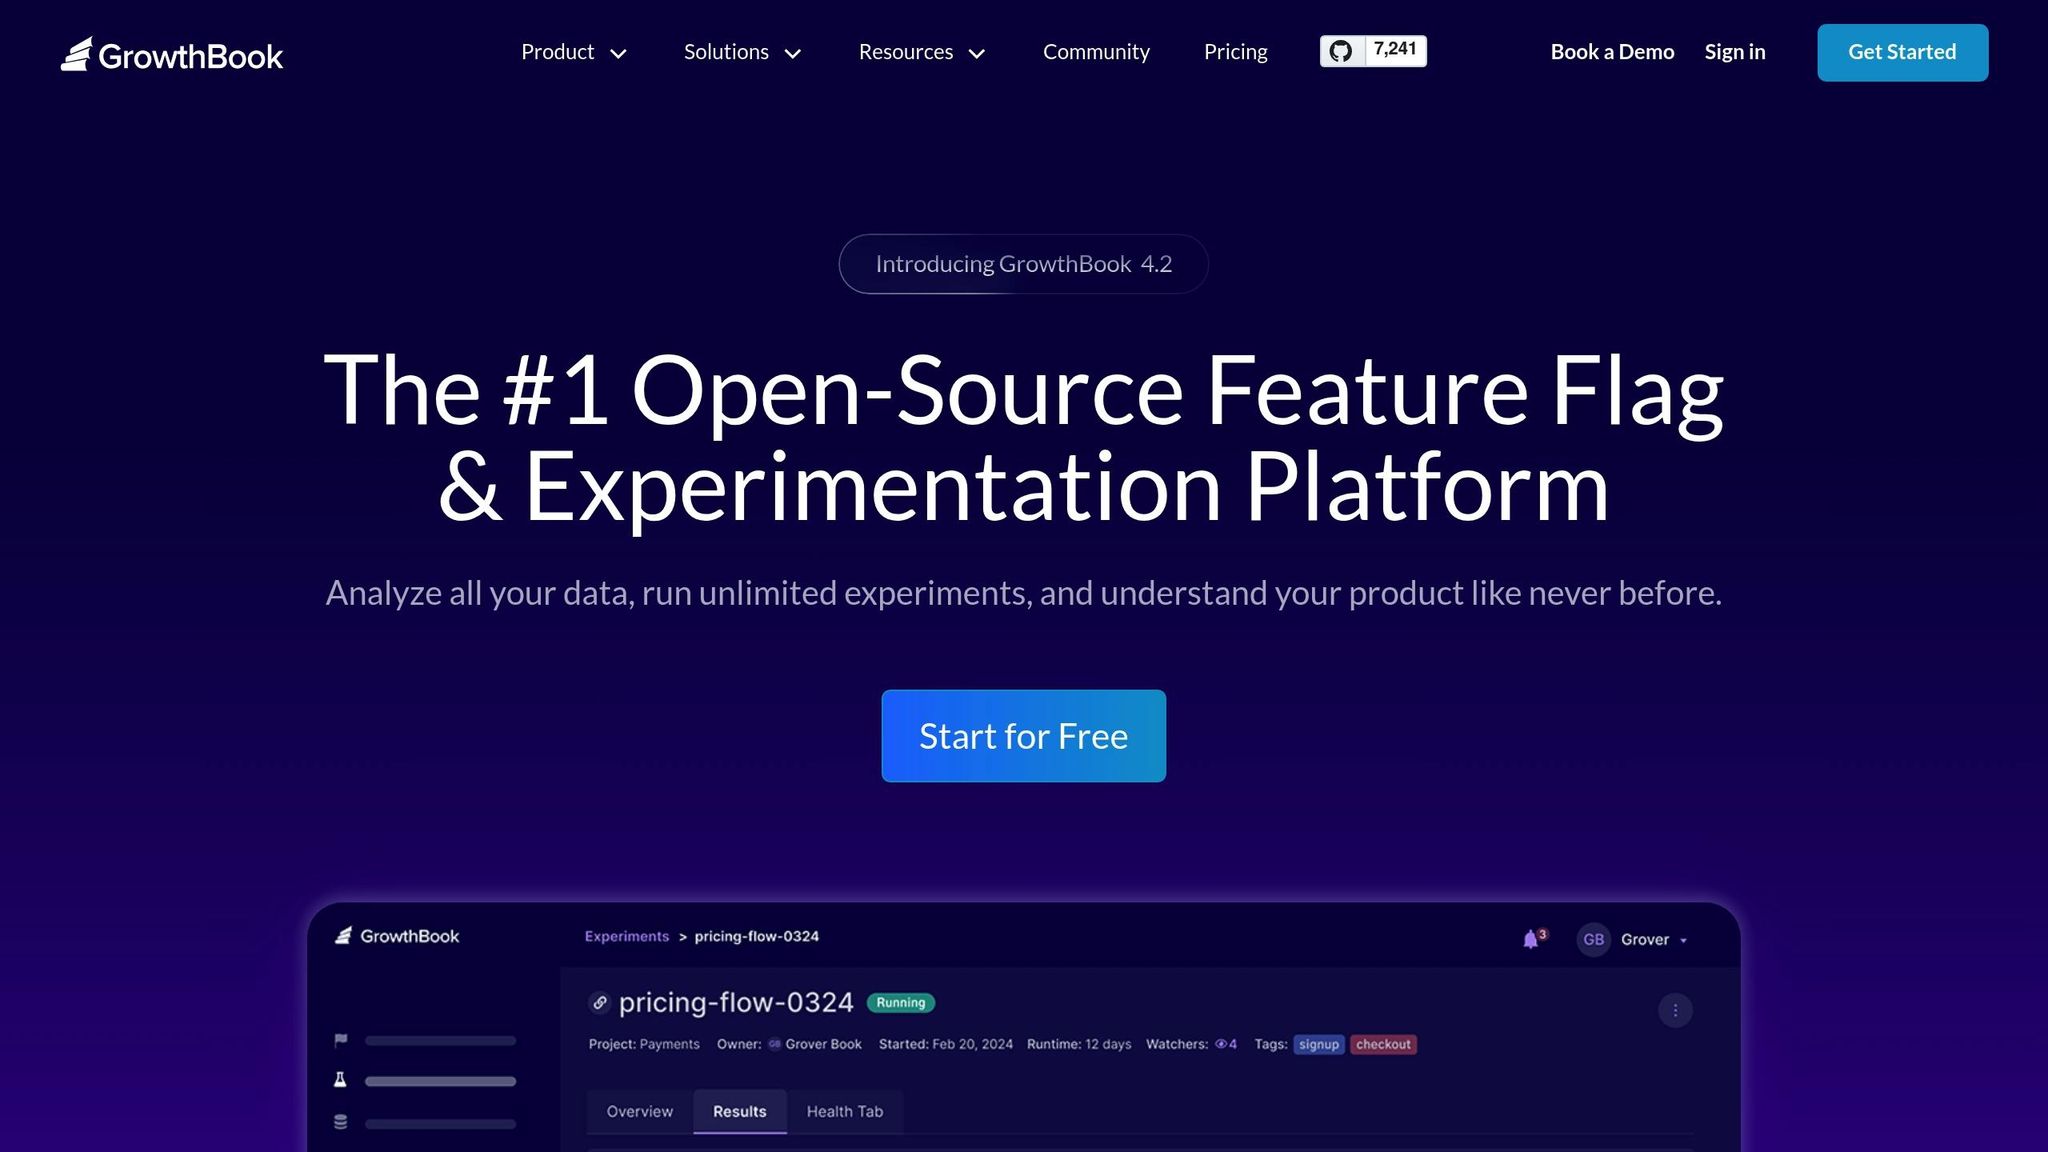
2. GrowthBook
GrowthBook stands out by adopting a warehouse-native approach to experimentation analytics. Instead of sending raw user data to external servers, it connects directly to your existing SQL data warehouses. This method keeps sensitive data safe within your infrastructure while still providing powerful analytics.
Built-in Experimentation Analytics
GrowthBook supports both Bayesian and Frequentist statistical models, offering advanced tools like CUPED, Sequential Testing, and SRM detection. What’s more, it provides full transparency by displaying the generated SQL and allowing exports. This flexibility means teams can choose the framework that aligns best with their needs.
The platform also includes a no-code visual editor for setting up front-end A/B tests. Impressively, GrowthBook handles over 100 billion feature flag lookups daily[12]. Thanks to its modular design, you can use GrowthBook for just feature flagging, experiment analysis of raw data, or as a comprehensive end-to-end solution.
Next, let’s explore how GrowthBook enables real-time decision-making with its insights.
Real-Time Insights
GrowthBook’s SDKs evaluate feature flags locally without making network requests, ensuring high performance and minimal latency. With Sequential Testing, teams can review results in real time while maintaining statistical accuracy. An automated health page continuously monitors experiment exposure, performs data quality checks, and flags SRM warnings when potential implementation issues arise.
The Bayesian engine adds another layer of insight by calculating a "Risk" metric, which predicts potential losses from incorrectly selecting a variation as the winner. Teams can also filter results to focus on users who interacted with a feature, reducing noise and improving the reliability of findings. GrowthBook’s infrastructure boasts an impressive 99.9999% uptime[12].
Targeting Options
GrowthBook enhances its analytics capabilities with precise targeting features. It uses custom attributes - such as user ID, country, or subscription plan - passed into its SDK to define specific experiments or feature rollouts. The platform offers both a user-friendly interface for basic targeting and an "Advanced Mode" for more complex logic, leveraging MongoDB-inspired JSON syntax for tasks like nested operators or version comparisons.
To ensure consistency, deterministic hashing guarantees that users see the same variation across sessions without requiring server-side state storage. Namespaces help avoid conflicts by keeping experiments mutually exclusive, while Saved Groups let teams create reusable audience segments (e.g., "Beta Testers" or "High-Value Customers"). Sensitive data is securely hashed using SHA-256.
SDK and Integration Support
GrowthBook provides lightweight SDKs for all major environments. For example, its JavaScript SDK is just 9KB - far smaller than many competitors[12]. Like all its SDKs, it evaluates targeting logic locally. For scenarios where privacy is a priority, a "Remote Evaluation" mode is available.
The platform offers a free tier with unlimited feature flags, traffic, and experiments. Its open-source nature also allows teams to self-host for added control and security. To enable experimentation analytics, developers can use a tracking callback within the SDK to log which variation each user sees into their analytics tools or data warehouse. Additionally, Server-Sent Events (SSE) enable real-time updates, instantly pushing feature changes to the SDK.
3. Split.io

Split.io, now part of Harness Feature Management & Experimentation (FME), combines feature flagging with experimentation analytics in a single platform. This integration eliminates the need for separate tools or external data connections. Similar to Statsig and GrowthBook, Split.io merges feature flagging with real-time analytics to streamline decision-making during experimentation.
Built-in Experimentation Analytics
Split.io offers support for multiple statistical frameworks, including Frequentist, Bayesian, and sequential testing, giving teams the flexibility to choose the approach that works best for their projects [13]. It adheres to a Microsoft-researched minimum sample size of 355 observations per treatment group to ensure reliable results [13]. The platform’s Attribution and Exclusion algorithm calculates impact retroactively, while guardrail checks - like Sample Ratio Mismatch detection and review period validations - help maintain data accuracy [13].
The Harness Release Agent leverages AI to interpret experiment outcomes, highlight metric shifts, and provide actionable recommendations for rolling out or rolling back features [14][16]. Adobe Workfront shared that before adopting Split.io, they faced a 20–40% spike in support cases during the first two weeks of a code release. After implementing Split.io's feature flagging and monitoring, those issues dropped to almost zero [14][15].
Real-Time Insights
Split.io excels at identifying and addressing release issues quickly. Its automated issue detection system can pinpoint problems in under a minute [14][15]. Teams receive instant alerts when gradual feature rollouts negatively impact performance, enabling them to activate automated kill switches for immediate rollbacks [14][18]. The platform’s attribution engine links feature flags directly to performance metrics, identifying the specific flag causing a change within seconds of activation [18][20]. This level of observability allows teams to troubleshoot effectively, even during overlapping rollouts.
"Split makes it possible to really understand how our users respond to the changes we make. Now it's easy to know the best change for our users." - Jean Steiner, Ph.D., VP of Data Science, Skillshare [14]
Targeting Options
Split.io supports gradual rollouts to specific customer groups or random samples, making it ideal for beta testing [14][15]. Teams can segment users based on factors like customer tiers to manage API rate limits [15][21]. Dynamic configurations allow teams to adjust software features in real-time without deploying new code [14][15]. The platform uses Murmur hashing locally within the SDK to determine feature treatments, ensuring both speed and data privacy [14][17]. Split.io is designed to scale efficiently, handling millions of users without sacrificing performance [14][15].
SDK and Integration Support
Split.io provides native SDKs for more than 15 programming languages, including Android, iOS, JavaScript, React, Java, .NET, Node.js, Python, Go, Ruby, and PHP [14]. For environments without native SDKs, the "Split Evaluator" tool - available via Docker - calculates treatments through a REST API [17]. The "Optimized" impression mode reduces network and storage demands by queuing only unique impressions for experimentation purposes while maintaining data accuracy [17]. Additionally, "Flag Sets" allow teams to group and manage multiple feature flags across various environments [17]. Split.io has earned high praise from users, holding a 4.7/5 rating on G2 Crowd [19].
sbb-itb-0499eb9
4. Mixpanel Experimentation 2.0
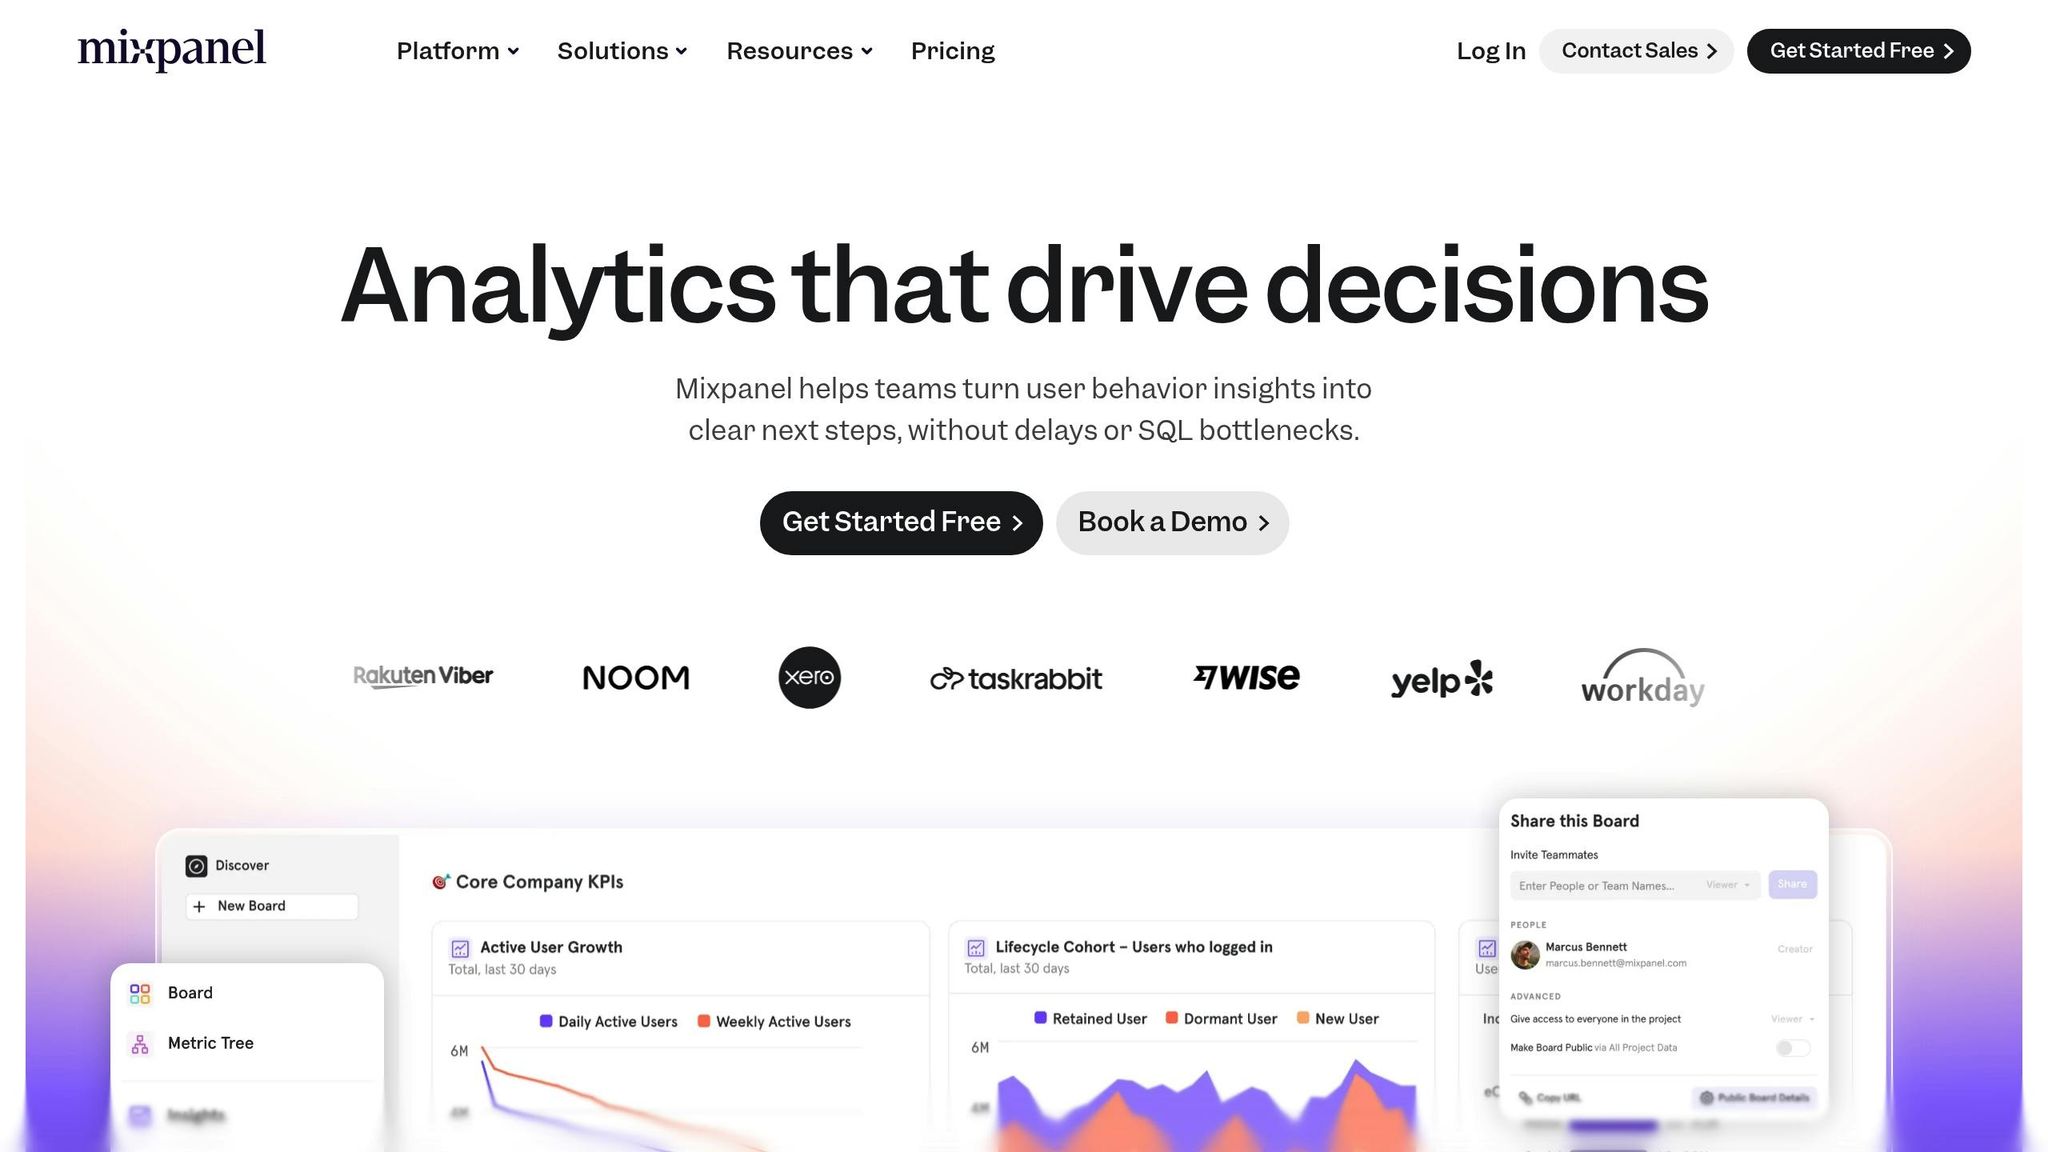
Mixpanel Experimentation 2.0 combines behavioral analytics, feature flagging, and experimentation into one streamlined platform. By leveraging pre-tracked events, cohorts, and metrics, it eliminates issues like data drift and fragmented workflows [23].
Built-in Experimentation Analytics
The platform uses Frequentist methods and sequential testing (mSPRT), applying standard statistical models to analyze metrics such as counts, rates, or values [26][28]. Teams can evaluate the impact of changes using any existing Mixpanel metric - whether it's business, performance, or behavioral - without the need to set up new tracking systems [25].
Sequential testing enables early decisions by allowing tests to stop as soon as statistical significance is reached, making it particularly effective for detecting changes of 10% or more [26]. Results are seamlessly integrated with tools like Session Replays, Metric Trees, and behavioral cohorts, providing insights into not just what happened but also why users responded the way they did [23][25]. For statistical calculations, Mixpanel defaults to a 95% confidence threshold [26].
In 2024, Step, a financial services company, used Mixpanel's Experimentation to increase direct deposits by 14%. Chief Product Officer Guillaume Lebleu incorporated the tool into routine review meetings, relying on saved metrics and backend data synced through Warehouse Connectors to make quick, data-driven decisions [22][23].
"We've made Mixpanel Experimentation a key part of our regular Experiments review meeting. We now have a dashboard that is simple to set up for each experiment, that is fast and trusted by everyone." - Guillaume Lebleu, Chief Product Officer, Step [23]
Real-Time Insights
Mixpanel provides real-time monitoring of experiment performance, supported by millisecond-level flag API latency. It tracks exposures through the $experiment_started event, ensuring that only users impacted by the experiment are analyzed [22][23][24][26].
Teams can keep an eye on guardrail metrics, such as churn rate or customer satisfaction, while focusing on primary success metrics. This ensures that new features don’t unintentionally harm key aspects of the business [26][28]. Unlike traditional testing methods that discourage early evaluations, the mSPRT method allows teams to continuously review results without compromising statistical accuracy [26].
"We can now release a feature, hypothesize its impact, and measure results immediately. Being able to do that without having to leave the tool that already has all of our data, all of our core analytics, and all of our reports just made sense." - Matthew Corley, Head of Engineering, Outlier [22]
This real-time feedback loop makes targeted feature rollouts more efficient and reliable.
Targeting Options
Mixpanel enables precise targeting of users based on behavioral cohorts, runtime properties, or runtime events [24]. It supports randomization units such as User ID (distinct_id), Device ID, or Group ID, with the ability to manage up to five variants and rollout groups for each feature flag [24]. The "Sticky Variants" feature ensures users have a consistent experience, even if targeting criteria are updated later [24].
SDK and Integration Support
To complement its analytics and targeting capabilities, Mixpanel provides extensive SDK and integration support.
The platform offers native SDKs for both client-side and server-side platforms [24][27]. It can also analyze experiments launched through external feature flagging tools by tracking the $experiment_started exposure event [26][28].
Experimentation is available as a paid Enterprise add-on, with pricing based on Monthly Experiment Users (MEUs). Costs for feature flags depend on API requests and active flags, but exposure events are included at no extra charge in regular plans if the Experimentation add-on is purchased [24][26][28].
5. Datadog Feature Flags
Datadog takes an observability-first approach, combining integrated analytics with experimentation to align system performance and feature management. With Datadog Feature Flags, teams can directly link feature management to telemetry data from APM, RUM, Logs, and SLOs. This integration allows for a unified view of how flag changes impact system performance and reliability metrics [29].
Built-in Experimentation Analytics
Datadog bridges feature flags with real-time observability, helping teams evaluate how each release affects both technical performance and business outcomes [29]. Engineers can monitor metrics such as response times and error rates, ensuring new features enhance user experience without compromising system health. While some platforms focus on marketing metrics like conversion rates [18], Datadog prioritizes engineering reliability and system monitoring [29]. This tight integration also enables faster incident response when issues arise.
Real-Time Insights
With live telemetry, teams can quickly spot problems and initiate automated rollbacks [29]. For instance, during an incident, engineers can search for active flags and connect error spikes to specific rollouts, allowing for immediate feature rollbacks if regressions occur. The platform also includes a "circuit breaker" feature that automatically pauses or reverses rollouts when Service Level Objectives (SLOs) are at risk [29].
"Every rollout is automatically tracked against the health indicators you already monitor." - Datadog [30]
Targeting Options
Datadog goes beyond analytics and monitoring by offering advanced audience segmentation. Teams can tailor feature releases for specific environments, services, or user groups, ensuring minimal disruption during rollouts. Automated canary releases adjust based on live monitor thresholds, while AI configurations - such as prompts and models - can be targeted to specific audiences. If performance metrics fall outside acceptable ranges, the platform can initiate automated rollbacks [29].
SDK and Integration Support
Datadog uses the OpenFeature SDK, providing a vendor-neutral solution that integrates seamlessly with its Product Analytics and Real User Monitoring tools [30]. It also leverages Bits AI and MCP integrations to automatically clean up stale flags, reducing technical debt [29]. For those interested, Datadog offers a 14-day free trial of its full suite, including Feature Flags [29]. Additionally, Datadog has been recognized as a Leader in the Gartner® Magic Quadrant™ for Digital Experience Monitoring [29].
Comparison: Strengths and Weaknesses
Building on the detailed reviews above, let’s take a closer look at how each platform shines and where it might fall short.
Each tool brings something unique to the table, catering to different team needs. Statsig offers an all-in-one solution with real-time monitoring and detailed analytics. It supports over 30 open-source SDKs and includes a free tier for up to 2 million events per month [18]. Its standout "Pulse" feature enables live A/B testing, but the warehouse-native mode is restricted to Enterprise contracts and may add computation costs [18].
GrowthBook targets data-savvy teams with its open-source, warehouse-native design, which reduces dependency on vendors. However, it often requires significant input from data teams to integrate with existing data warehouses like BigQuery or Snowflake [18].
Split.io is all about measuring real-time impact. Its built-in monitoring quickly shows how features influence performance metrics and sends instant alerts. That said, setting up effective monitoring can be a bit complicated for some users [18].
Mixpanel Experimentation 2.0 is a natural fit for teams already using Mixpanel, seamlessly blending experimentation with product analytics.
Datadog Feature Flags focuses on observability and real-time telemetry, making it a go-to for teams that prioritize technical performance and system monitoring.
| Tool | Analytics Depth | Real-time Reporting | Targeting Features | SDK Support | Free Tier / Pricing |
|---|---|---|---|---|---|
| Statsig | Advanced (Built-in) | High | Sophisticated/Behavioral | 30+ SDKs | Free up to 2M events |
| GrowthBook | Advanced (Warehouse-native) | Varies with warehouse | Visual Editor/Rules | Broad (e.g., TS, Python, Go) | Free (self-hosted) |
| Split.io | Advanced (Impact-focused) | Real-time Alerts | Traffic Segmentation | Comprehensive | Free for up to 10 seats |
| Mixpanel | Integrated with Analytics | Real-time | Event-based Cohorts | Major Platforms | - |
| Datadog | Observability-first | Live Telemetry | - | OpenFeature SDK | - |
This comparison highlights the importance of aligning your choice with your team’s priorities. Whether you value statistical precision (Statsig, GrowthBook), immediate insights (Split.io), unified analytics (Mixpanel), or system observability (Datadog), there’s a tool tailored for your needs.
"The biggest benefit is having experimentation, feature flags, and analytics in one unified platform. It removes complexity and accelerates decision-making."
Conclusion
Each platform discussed brings its own strengths to the table when it comes to combining feature flags with experimentation analytics. The best choice depends on your team size, data infrastructure, and where you are in your growth journey.
For smaller teams, Statsig offers a fast and flexible solution with strong analytics and real-time monitoring. GrowthBook, with its modular setup, lets teams start small - focusing on feature flags - and expand into experimentation as their needs grow.
Split.io shines with its real-time impact measurement and automatic performance monitoring, a standout feature highlighted in this review. If you're already using Mixpanel, Mixpanel Experimentation 2.0 integrates seamlessly with its product analytics. Meanwhile, Datadog Feature Flags is an excellent choice for teams prioritizing observability and system performance.
Consider your team’s structure and data maturity. If you have a dedicated data team and a centralized data warehouse, warehouse-native solutions can streamline your processes. For teams with fewer resources, cloud-hosted platforms with generous free tiers are a great way to start experimenting without the need for heavy infrastructure. Testing out free plans first can help validate your workflow before committing to an enterprise-level plan.
The right tool simplifies your processes and speeds up decision-making, allowing your team to focus on building features that drive growth and innovation.
FAQs
::: faq
How do Statsig and GrowthBook differ in analytics and integration?
Statsig takes a streamlined approach by integrating analytics directly into its platform. It combines feature flags, experiments, and analytics in one unified system, leveraging advanced statistical techniques like CUPED and stratified sampling. All analyses are conducted within the platform itself, eliminating the need for external tools or data exports. This setup makes it easy to get started without requiring additional integrations.
In contrast, GrowthBook handles analytics differently. Its SDK sends tracking data to your own data warehouse, where its stats engine generates experiment reports. While this modular design allows for greater flexibility, it demands more effort to set up and maintain, including the need to configure a connection to your data warehouse.
Ultimately, Statsig offers an integrated, straightforward solution, while GrowthBook delivers more customization but with added complexity. :::
::: faq
How does Datadog's observability-focused approach enhance feature flagging and experimentation?
Datadog takes an observability-centered approach by embedding feature flag data directly into its monitoring tools. This integration provides real-time insights into how feature flags impact performance, user experience, and key metrics. The result? Teams can roll out updates faster and with greater confidence, all while keeping potential risks in check.
What sets Datadog apart is its combination of feature flagging and built-in experimentation analytics. By eliminating the need for additional integrations, this streamlined setup empowers businesses to make data-driven decisions and fine-tune their strategies for growth with greater efficiency. :::
::: faq
What is the best free feature flagging and experimentation tool for small teams just starting out?
For small teams eager to dive into feature flagging and experimentation without spending a dime, ConfigCat’s Forever Free plan is hard to beat. It provides unlimited seats and full access to flag-management tools - all without asking for a credit card.
Unlike other platforms that might offer free trials or basic starter plans, many of these come with strings attached, like limited features, user caps, or mandatory payment information. ConfigCat’s free tier is a perfect starting point for small teams ready to explore feature flagging and experimentation hassle-free. :::
Related reading
- Time to Value (TTV): How the Best SaaS Companies Measure and Reduce It
- Customer Activation Metrics: The 7 KPIs Every Product Team Should Track
- User Activation Rate: How to Find and Fix Your SaaS Aha Moment
- The SaaS Monetization Audit: Are You Leaving Revenue on the Table
- SaaS Time to Value Benchmarks 2026: Average TTV by Category
Useful tools & services
Go deeper than any blog post.
The full system behind these articles—frameworks, diagnostics, and playbooks delivered to your inbox.
No spam. Unsubscribe anytime.