Common Mistakes in Measuring Growth Advisory ROI
Avoid common ROI missteps for growth advisory: set clear KPIs, account for hidden costs, use control groups, integrate data, and measure over time.
Common Mistakes in Measuring Growth Advisory ROI
When measuring the ROI of growth advisory services, businesses often fall into common traps that lead to inaccurate conclusions. These mistakes can waste resources, misguide decisions, and erode trust in the process. Here’s what you need to know upfront:
- Set Clear, Measurable Goals: Vague objectives like "increase revenue" make it impossible to track success. Use specific KPIs tied to business outcomes (e.g., revenue growth, customer retention).
- Don't Measure ROI Too Early: Many initiatives take months or years to show results. Premature evaluations often undervalue long-term strategies.
- Avoid Vanity Metrics: Metrics like impressions and likes don’t show actual business impact. Focus on metrics that connect directly to revenue, like CAC or LTV.
- Account for Hidden Costs: Internal labor, software fees, and lost productivity often inflate the true cost of advisory efforts.
- Consider External Factors: Revenue changes might result from market trends, not advisory efforts. Use control groups to isolate the advisor’s impact.
- Integrate Your Data: Disconnected systems lead to conflicting ROI numbers. Build a unified data source for accurate analysis.
- Be Realistic About Benefits: Overestimating outcomes or ignoring implementation challenges inflates ROI expectations.
- Measure ROI Continuously: ROI evolves over time. Regular tracking ensures you capture the full picture of an advisor’s contributions.
Business Reviews Masterclass: Measure & Present ROI
::: @iframe https://www.youtube.com/embed/8skNeQD8Dko :::
Mistake 1: Not Setting Clear, Measurable Goals
Defining success starts with setting clear, quantifiable objectives. Surprisingly, over a third of B2B marketers don’t track their return on investment (ROI) at all [2]. Without specific goals, it’s nearly impossible to evaluate whether your growth advisory services are delivering results - or if the outcomes are just coincidental.
The issue often stems from vague ambitions like "increase revenue" or "improve customer engagement." While these may point in the right direction, they lack the precision needed to measure success. Instead, aim for goals with clear parameters: target revenue increases, deadlines, and specific customer segments. Without such details, it’s difficult to determine if an advisor’s recommendations are driving change or if external factors are at play. This lack of clarity also makes it harder to select meaningful key performance indicators (KPIs), which we’ll dive into next.
Why KPIs Matter
KPIs help track progress over time, while ROI measures the financial outcome [2]. The most effective KPIs are tied to core business results - like revenue growth, profit margins, customer retention, or cost savings. These metrics are far more telling than activity-based metrics (e.g., number of meetings or emails), which don’t necessarily reflect real value [3].
Take PepsiCo’s campaign as an example. It achieved impressive social media stats but failed to boost sales, highlighting the gap between vanity metrics and actual business outcomes [10]. As Traci Alford, President and CEO of Effie Worldwide, puts it:
"ROI is an important metric, but it's just one piece of the effectiveness puzzle. Its relevance depends entirely on the business objective in question." [9]
Today, 81% of professional communicators rely on numerical data to prove their efforts’ value. However, that data only matters if it measures the right things [2]. To avoid being overwhelmed by irrelevant metrics, focus on 3–5 high-level outcome indicators. For growth advisory engagements, these might include monthly recurring revenue (MRR), customer acquisition cost (CAC), lead-to-close conversion rate, or net revenue retention (NRR).
Once you’ve established KPIs, the next step is setting realistic goals to measure progress effectively.
How to Set Realistic Goals
The SMART framework is a great starting point: goals should be Specific, Measurable, Attainable, Realistic, and Time-bound [6]. For example, instead of saying "increase sales", aim for something more concrete like, "generate 50 qualified enterprise leads per month within 90 days, with a target close rate of 15%."
Before starting an advisory engagement, establish a financial baseline. This includes metrics such as your current conversion rates, average deal size, and sales cycle length. This baseline helps you measure the "lift" generated by your advisor’s efforts [3]. Without it, you risk misattributing improvements to seasonal trends or market changes.
Another key step is determining your breakeven point. If your advisor charges $10,000 per month [4], calculate how many new customers you’ll need to cover that cost. For instance, if your average deal is worth $50,000 annually and you close 20% of qualified leads, each lead is worth $10,000. This means closing just one deal per month would cover the advisor’s fee. Be sure to define what "qualified" means for your business, whether that’s based on company size, decision-making authority, budget, or specific challenges. This ensures you’re not counting leads that look promising but fail to convert.
It’s also crucial to establish a consistent review process. A weekly check-in on your primary KPIs keeps your team aligned and allows for quick adjustments if needed [7]. Share these goals with everyone involved in the advisory engagement to foster accountability and alignment. Early feedback can help identify potential roadblocks, such as unrealistic timelines or metrics that don’t fully align with your objectives [6].
The aim isn’t to create a flawless measurement system but to set clear, honest benchmarks. These benchmarks make it possible to evaluate whether your investment in growth advisory services is delivering real results. Without this clarity, calculating ROI becomes a guessing game - making it even harder to measure the true impact of your advisor’s work.
Mistake 2: Measuring ROI Too Soon
Measuring ROI too early often leads to inaccurate conclusions. A surprising 77% of digital marketers assess ROI within the first month of launching a campaign, even though 52% report sales cycles lasting three months or longer [11]. This disconnect between evaluation timing and actual sales cycles creates a skewed understanding of a campaign's effectiveness.
When ROI is evaluated prematurely, the full impact of an advisor's work is overlooked. Ami Trivedi, a Product Marketing and Strategy Leader, emphasizes this point:
"The full return on a campaign cannot be accurately determined until after the sales cycle is completed" [11].
The consequences of rushing ROI measurement can be significant. Only 4% of marketers measure ROI over six months or longer, which aligns better with the typical B2B sales cycle [11]. As a result, companies might abandon strategies that could have succeeded with time, while doubling down on approaches that show early promise but lack long-term viability. Rob Petersen, Founder of Barnraisers LLC, puts it plainly:
"If you try to calculate your ROI too soon, you may undervalue the amount of impact that investments are making" [10].
This haste is often driven by external pressures. 58% of marketers feel the need to prove ROI quickly to justify spending and secure future budgets [11]. However, prioritizing short-term results can harm long-term growth by confusing Key Performance Indicators (KPIs) - which track interim progress - with ROI, which measures the final financial outcome. Sean Callahan, Senior Manager of Content Marketing at LinkedIn, explains:
"KPIs tell you what happens after each chapter, while ROI tells you what happened at the end of the story" [8].
This premature focus on ROI can distort comparisons with longer-term strategies, which we’ll explore further in the next sections.
Understanding ROI Timeframes
In growth advisory services, different initiatives require varying evaluation periods. Applying a one-size-fits-all timeline can lead to flawed conclusions.
- Efficiency improvements, like streamlining operations, often show results within a year [15].
- Sustaining growth initiatives, such as launching new products for existing customers, typically take 1–2 years to yield measurable ROI [15].
- Transformative growth, such as entering new markets or creating new business models, may need 3–5 years to fully demonstrate returns [15].
For context, consider the healthcare sector. Some investments take 10 to 20 years to deliver measurable returns, such as reduced complications and cost savings [8]. While growth advisory work seldom requires this level of patience, it underscores an essential truth: meaningful change takes time.
SaaS businesses also follow specific benchmarks. A healthy Customer Acquisition Cost (CAC) payback period is generally under 12–18 months for SMB customers and under 24 months for enterprise clients [5]. To fully evaluate a growth advisor’s impact on these metrics, you need to account for the entire customer lifecycle.
Growth initiatives often follow an "S-curve" pattern, where performance may dip before rebounding and trending positively toward the end of the year [12]. Measuring ROI during this dip could lead to prematurely abandoning a strategy that was on the verge of success.
By recognizing these varied timelines, you can better align your measurement practices with the nature of your initiatives.
Building Patience into Measurement
The solution isn’t to stop measuring - it’s to measure more effectively. Accurately assessing ROI for growth advisory services requires patience and alignment with campaign lifecycles. Here’s how to approach it:
- Align measurement windows with sales cycles: Use a 3–4 month testing window as a baseline. Allow 8–12 weeks to establish normal performance patterns, followed by another 6–8 weeks to evaluate whether the advisor's recommendations are driving real improvement [3].
- Use regular checkpoints: Monitor leading indicators frequently, but reserve final ROI evaluations until the sales cycle is complete. Incorporate control groups to isolate the advisor’s impact [3].
- Set realistic expectations: Avoid expecting immediate results. Instead, align projections with the typical timeline for your specific initiative. Allow extra time for transformative projects that require market education or behavioral shifts [15].
- Differentiate between short- and long-term ROI: While operational improvements may yield quick benefits, strategic growth efforts often require a 2–5 year horizon for full evaluation [16].
Mistake 3: Tracking Vanity Metrics
::: @figure 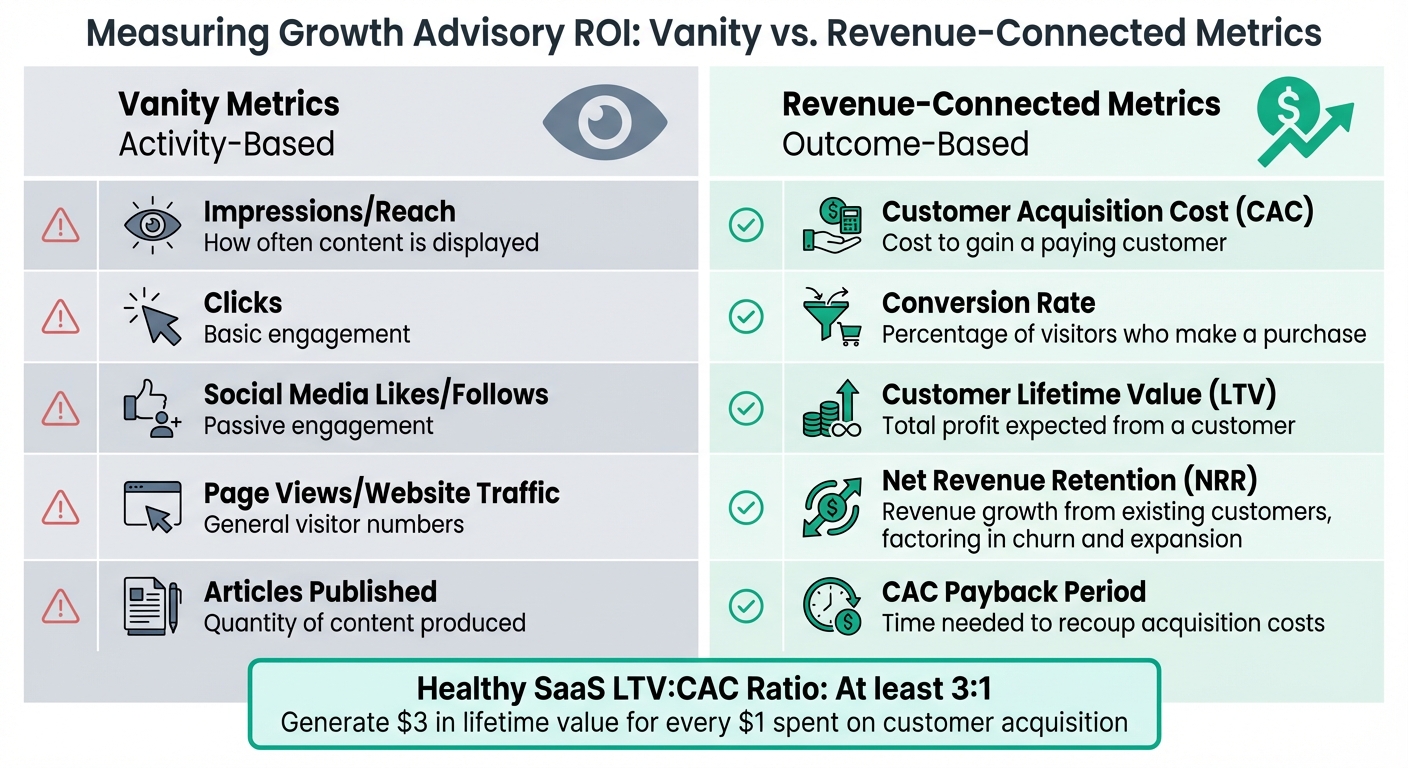 :::
:::
When it comes to assessing ROI, tracking the wrong metrics can be just as misleading as poor timing. Vanity metrics - like impressions, clicks, and likes - may look impressive, but they don’t provide a clear connection to revenue or profitability [18]. These numbers often highlight activity rather than actual outcomes, making them ineffective for driving real business decisions.
Michael Stearns, Founder of Ascend Digital Agency, sheds light on the issue:
"Many agencies inflate results by leaning on vanity metrics, only for clients to later find these KPIs non-actionable" [18].
In 2024, U.S. internet ad revenue hit $259 billion, with 91% of digital display ads purchased programmatically. Unfortunately, these systems often prioritize surface-level metrics like impressions, leaving businesses focused on numbers that don’t translate into growth [3]. Business coach Allison Dunn describes the fallout:
"They had measured activity, assumed causation, and built entire departments around optimizing metrics that turned out to be largely decorative" [3].
To avoid this trap, businesses need to focus on incrementality - the measurable lift in sales or revenue directly caused by a specific strategy. Instead of asking, “How many people saw our content?” the question should be, “How many additional customers did we gain because of this approach?”
Vanity Metrics vs. Revenue-Connected Metrics
The key difference between these two types of metrics lies in their ability to inform decisions that impact revenue. If a metric looks good while your business struggles financially, it’s likely a vanity metric. Here’s a side-by-side comparison:
| Vanity Metrics (Activity) | Revenue-Connected Metrics (Outcomes) |
|---|---|
| Impressions/Reach: How often content is displayed [18] | Customer Acquisition Cost (CAC): Cost to gain a paying customer [17][18] |
| Clicks: Basic engagement [18] | Conversion Rate: Percentage of visitors who make a purchase [18] |
| Social Media Likes/Follows: Passive engagement [6][18] | Customer Lifetime Value (LTV): Total profit expected from a customer [5] |
| Page Views/Website Traffic: General visitor numbers [6] | Net Revenue Retention (NRR): Revenue growth from existing customers, factoring in churn and expansion [17][5] |
| Articles Published: Quantity of content produced [6] | CAC Payback Period: Time needed to recoup acquisition costs [5] |
For SaaS businesses, a healthy LTV:CAC ratio should be at least 3:1. This means you’re generating $3 in lifetime value for every $1 spent on customer acquisition [5]. Metrics like these are essential for determining whether your strategies are genuinely delivering value.
Finding Actionable Metrics
Actionable metrics meet the "So What?" test - if doubling your website traffic doesn’t boost revenue, those extra page views are just noise. The metrics that matter are the ones that directly tie to business outcomes and guide future investments.
Take the example of Soft Surroundings. In August 2025, the retailer used an incrementality platform to reduce its retargeting budget by 52%, shift funds to Facebook prospecting, and achieve 17% month-over-month revenue growth alongside a 12% annual sales increase. This success highlights the importance of focusing on metrics that show clear, causal impacts [19].
To identify actionable metrics, prioritize those that reveal incrementality - the direct lift in sales attributed to specific strategies. Use holdout tests by excluding a subset of your audience from a campaign and comparing their behavior to those exposed to the campaign [19]. This approach ensures you’re measuring the true impact of your efforts.
Stick to 3–5 core outcome metrics to avoid overwhelming yourself with data. Too many KPIs can obscure your business’s true health [3]. Break down your data by channel, customer type, or region, steering clear of blended averages that mask profitability in specific areas [5]. After all, increasing customer retention by just 5% can improve profits by 25% to 95% [20]. With precise metrics, you can pinpoint which strategies are driving these gains.
Ultimately, revenue-connected metrics are the only ones that can guide strategic decisions and confirm whether your growth strategies are paying off.
Mistake 4: Missing Hidden Costs
When businesses hire consultants, they often focus solely on the invoice amount. But the real costs can end up being 1.5–2× higher once you factor in internal labor and operational expenses [23]. This disconnect between expectations and reality often leaves leaders frustrated with projects that seemed profitable on paper.
Ryan Redmond from Optrua sums it up well:
"The gap between 'planned ROI' and 'real ROI' is why many leaders walk away from projects... because the true cost of ownership was never fully visible at the start" [23].
The Overlooked Costs Inside Your Business
One major blind spot is internal labor costs. For example, imagine a 10-person sales team rolling out a new CRM system. If each employee spends 200 hours on training and testing at $75 per hour, that adds $15,000 to the project - an expense often ignored during budgeting [23]. And that’s just the beginning. Other hidden costs include:
- Leadership time spent in meetings
- IT support for data migration and system integration
- Productivity dips during post-implementation adjustments [33,35]
Beyond labor, recurring expenses like premium support plans, API fees, storage overages, and software upgrades can quietly inflate monthly costs [33,35]. These small charges can snowball into significant financial burdens over time. For instance, 12% of tax departments reported annual penalties exceeding $1 million due to inefficiencies in manual processes [21]. On the flip side, companies that invested in automation avoided hiring additional staff, saving $200,000 annually [21].
How to Uncover Hidden Costs
To avoid surprises, start with a complete cost audit. Before making any changes, document your current processes, error rates, and team productivity. This baseline will help you measure the actual impact of any new initiative [26]. Then, dig into every expense category - subscriptions, credit card charges, utilities, and maintenance - and compare projections with actual spending [34,35].
When negotiating with vendors, ask tough questions about hidden fees upfront. For example:
- What are the limits on data migration?
- Are there extra charges for APIs or exceeding storage limits?
- Will software upgrades or premium support cost more?
Transparency at the start can save you from unpleasant surprises later [23].
Another tactic is to shadow your employees. This will help you spot inefficiencies that could create unexpected costs during implementation [24]. If your team is already stretched thin, adding new systems without addressing workflow bottlenecks can make things worse.
Consider rolling out changes in phases instead of all at once. A phased approach spreads costs over time, gives your team room to adapt, and allows you to gather feedback for smoother adoption [23].
Examples of Hidden Costs
Failing to account for hidden costs can obscure the true financial impact of your initiatives. Here’s a breakdown:
| Cost Category | Examples of Hidden Expenses | Impact on ROI |
|---|---|---|
| Internal Effort | Staff testing, IT overhead, leadership meetings | Increases "Cost of Investment" [23] |
| Operational | Data migration fees, API charges, storage overages | Reduces net gain [23] |
| Human Capital | Recruitment for turnover, training for new hires | Drains resources post-implementation [24] |
| Risk/Compliance | Late filing penalties, audit remediation | Direct financial leakage [31,34] |
| Productivity | Adoption dips, manual workarounds, trust erosion | Delays time-to-value [32,33] |
One of the most commonly overlooked expenses is opportunity cost - the time and energy your team diverts from revenue-generating activities. For example, if a founder spends 200 hours on non-revenue tasks, that’s a loss of $10,000–$40,000 (based on hourly rates of $50–$200) [25]. Similarly, a three-month delay in launching a product could cost a SaaS company $54,000 in missed revenue [25].
The Cost of Doing Nothing
It’s not just action that carries a price tag - inaction can be equally costly. As Terrapin Technologies points out:
"Inaction isn't neutral - it's the quiet accumulation of risks, inefficiencies, and missed opportunities that become harder and costlier to fix the longer you wait" [22].
With 58% of departments reporting they are under-resourced, many companies lack the tools to address compliance issues effectively. This can lead to mounting penalties and erode trust among employees [21]. By factoring in these hidden costs - whether from action or inaction - you’ll gain a clearer picture of whether your growth initiatives are truly delivering value.
Mistake 5: Ignoring External Factors
Business revenue naturally fluctuates by 10–15% each month due to deal timing, seasonal trends, and market conditions. Attributing all revenue increases to a growth advisor without considering these external influences can lead to misleading conclusions [3]. If you don’t account for these factors, you might end up celebrating results that would have occurred anyway.
Allison Dunn, CEO of Deliberate Directions, explains this clearly:
"Incrementality means measuring lift above a baseline. If you spend $100,000 on advertising and revenue increases by $150,000, you need to know how much of that increase would have happened anyway" [3].
In fact, up to 70% of sales attributed to a specific initiative might have happened regardless, driven by elements like brand reputation, seasonal demand, or product innovation [27]. Failing to isolate these variables can lead to ROI calculations that overstate your advisor's true impact.
To accurately measure an advisor's contributions, you need to separate their influence from these external factors.
Using Control Groups or Cohorts
The most dependable way to measure true impact is through holdout tests. This involves excluding a portion of your audience or business units from the advisory intervention. By comparing the results of the test group (those who implement the advisor's recommendations) with the control group (those who don’t), you can identify the incremental difference the advisor made [3][29].
For instance, if your advisor proposes a new sales strategy, you could implement it with half your sales team while the other half sticks to the current approach. Monitor both groups over a 6–8 week trial period, ensuring you test only one variable at a time. This keeps the results clear and avoids confusion caused by overlapping changes [3].
Before starting any test, it’s crucial to establish a baseline by tracking key metrics for 8–12 weeks. This helps you understand your business’s "normal variation", making it easier to spot genuine improvements rather than random fluctuations [3]. Without this baseline, you’re essentially guessing whether changes are meaningful or just noise.
This approach not only clarifies the advisor's impact but also sets the stage for future refinements, especially when factoring in broader market influences.
Adjusting for Market Conditions
Even with control groups, external factors like economic changes, competitor actions, or seasonal trends can distort your results. Marketing Mix Modeling (MMM) helps isolate the advisor’s contributions by accounting for variables such as holiday spikes, competitor price reductions, or economic downturns. This ensures your long-term strategies are assessed with greater accuracy [29][27].
Additionally, analyzing data over 7–14 day trends can smooth out short-term market fluctuations [28]. This prevents you from making rash decisions based on temporary noise and allows for a clearer understanding of performance trends over time.
Mistake 6: Poor Data Integration
When your CRM, billing, ad, and analytics systems don't talk to each other, measuring ROI for growth advisory services becomes a nightmare. This lack of integration creates a chaotic situation where multiple platforms claim credit for the same sale, inflating ROI figures and making them unreliable [31].
The consequences of disconnected systems are costly. For every dollar spent on fragmented data, 35 cents in potential opportunities slip away [31]. To make matters worse, search marketing data often exaggerates its effectiveness - sometimes by two to 10 times - when it's not connected to other touchpoints [31]. This means you're making decisions based on incomplete or misleading information.
These silos also spark internal disagreements. Finance, growth, and product teams often argue over whose data is correct [5]. When everyone uses different numbers and definitions, time is wasted debating metrics instead of focusing on performance. This misalignment not only skews ROI calculations but also highlights the need for an integrated approach to data.
Why Unified Data Systems Matter
A unified data system changes the game by providing a full view of your customer journey and business results. Instead of analyzing channels in isolation, you can track how customers move through your funnel - from their first interaction to the final purchase and beyond. This approach, often called a "customer-centric commercial view", captures the bigger picture, including brand influence, product updates, and external factors that siloed metrics miss [31].
Without integration, platforms like Google and Facebook often claim full credit for the same conversion, making ROI figures meaningless [31]. A unified system distributes credit across all touchpoints, revealing which channels are actually driving growth.
But attribution is just the start. Integrated data lets you calculate critical growth metrics like Customer Lifetime Value (LTV), Customer Acquisition Cost (CAC), and payback periods. These metrics require connecting top-of-funnel activities, like ad clicks, with bottom-of-funnel financial results [33].
Steps to Improve Data Infrastructure
If you want to fix your data issues, here are practical steps to create a more integrated system:
-
Build a single source of truth: Consolidate CRM, billing, ad, and analytics data into one centralized warehouse, such as Postgres or BigQuery [5]. This eliminates disputes over data accuracy and ensures everyone works from the same foundation.
-
Create a metrics dictionary: Define key metrics - like CAC, LTV, churn, and conversion rates - with clear formulas and data sources [5]. This ensures consistency across departments and avoids confusion, such as marketing and finance calculating CAC differently.
-
Automate data ingestion: Use APIs to pull data like ad spend, subscription details, and customer info into your central system automatically. This reduces manual errors and keeps your data up-to-date [5]. Companies using AI in their measurement processes have seen decision-making speed up by as much as 66% [32].
-
Segment your data: Break down your integrated data by acquisition channel, customer profile, or region. Blended, company-wide metrics can hide important details, while segmentation can reveal which channels or customer groups deliver better ROI [5].
Key Data Points to Track
To build a robust data infrastructure, focus on collecting these critical data points:
| Data Category | Required Data Points | Purpose |
|---|---|---|
| Customers | ID, signup date, segment, channel, sales owner | Attribution and segmentation |
| Subscriptions | Term start/end, status, plan, MRR delta | Revenue tracking and LTV |
| Ad Spend | Date, channel, campaign, cost | Calculating Paid CAC |
| S&M Costs | Month, cost type, amount, attribution | Calculating Blended CAC |
| Invoices | Service period, amount, COGS | Gross margin and payback period |
Improving your data infrastructure doesn’t just simplify ROI calculations - it gives you the clarity to make smarter, faster decisions that drive real growth.
Mistake 7: Overestimating Benefits Without Conservative Baselines
It’s easy to get swept up in optimism when you bring a growth advisor on board. You might find yourself imagining rapid revenue increases or quick wins. But this kind of thinking can lead to a dangerous pitfall - overestimating ROI and making decisions based on inflated expectations [13]. When the actual results don’t match these lofty projections, it can erode trust in future advisory efforts.
One major issue is underestimating the challenges of implementation. While consultants provide strategies and recommendations, it’s your team that has to execute them. The internal effort required to bring these ideas to life is often overlooked during initial projections [14]. This creates a mismatch between projected ROI and the reality of timing expenses versus seeing revenue gains.
Consider this: research shows that in some marketing campaigns, up to 70% of the reported sales might have happened even without the initiative being measured [27]. Without a realistic baseline, it’s hard to tell what’s truly driving growth versus what would’ve happened naturally. Ignoring this distinction skews ROI calculations and inflates the perceived value of advisory services.
Setting Conservative Projections
A realistic ROI starts with a solid foundation: a "no-work" baseline. This is essentially a forecast of how your business would perform if you didn’t launch any growth initiatives [12]. It allows you to measure the actual impact of your advisor’s efforts. To make this practical, calculate a break-even point by comparing advisor fees to the expected revenue from new customers. Make sure your projections align with this baseline [4].
Don’t forget to factor in growth constraints. Every market has limits - whether it’s audience size or market saturation - that will naturally slow your growth [12]. Using tools like Fermi estimation can help simplify predictions. Instead of focusing on overly precise numbers, round to broader figures like $100,000 or $1,000,000. WP Engine applied this approach during their Atlas product launch, setting clear goals that allowed them to focus on strategic assumptions rather than small errors in estimation.
Finally, go beyond basic ROI calculations. Simple formulas that only compare revenue to advisor fees often miss hidden costs. A more complete measure includes all expenses, such as Cost of Goods Sold (COGS), software subscriptions, agency fees, and internal labor. This approach gives a clearer picture of your Net Profit ROI [27].
| ROI Level | Formula | Reality Check |
|---|---|---|
| Simple ROI | (Revenue - Advisor Costs) / Advisor Costs | Ignores hidden costs |
| Gross Profit ROI | (Gross Profit - Advisor Costs) / Advisor Costs | Accounts for COGS |
| Net Profit ROI | (Net Profit - Advisor Costs) / Total Budget | Includes all implementation costs |
| Incremental ROI | (Incremental Net Profit - Advisor Costs) / Total Budget | Accounts for natural baseline sales |
Avoiding Best-Case Scenario Bias
Overestimating benefits often comes from relying on untested assumptions, which can lead to unreliable ROI results [34]. While conservative projections are a good starting point, you also need to guard against best-case scenario bias. Start by establishing clear baseline metrics before your advisor begins. Then, track actual performance against those metrics to ensure your projections stay grounded [13].
"Too much growth optimism can create unrealistic expectations."
One way to temper optimism is by reducing projected ROI based on your confidence level. For example, if you’re 80% confident in your projections, discount them by 20% to account for uncertainty [12]. This forces you to acknowledge that growth experiments don’t always deliver the expected results.
Be cautious of cherry-picking data. Focusing only on your most successful projects can inflate ROI figures while masking overall profit declines [1]. A global chemicals company avoided this mistake by supplementing traditional NPV calculations with factors like plant reliability and operational resilience. This balanced approach led them to shift 50% of their capital spending toward projects that aligned growth with stability [34].
Finally, keep in mind the benchmarks for high-growth SaaS companies. They typically aim for a Lifetime Value (LTV) to Customer Acquisition Cost (CAC) ratio of at least 3:1. Lower-margin businesses, on the other hand, often need ratios between 5:1 and 6:1 to achieve similar net value [35].
Mistake 8: Measuring ROI as a One-Time Event
Tracking ROI just once is like glancing at your bank account on January 1 and assuming it’ll stay the same all year. Growth advisory work doesn’t deliver results in a single flash - it builds up over time. Measuring ROI only once might catch you at a low point, before you’ve hit breakeven. This is particularly true for strategies like SEO and content marketing, which can take months to show real progress [4].
Jason Cohen, founder of Smart Bear, highlights the issue with early ROI calculations:
"The spreadsheet suggests (A) is the winner... But neither of those statements are true. If (A) could easily result in half its stated ROI, there's no objective justification to claim its superiority" [30].
Let’s say a project delivers 20% less impact and takes 50% longer than expected. The actual ROI ends up being half of what was initially projected [30]. Without ongoing tracking, you risk basing decisions on incomplete or misleading data. To get the full picture, it’s crucial to measure ROI continuously, capturing how it evolves over time.
The Case for Continuous Monitoring
Consistent tracking helps separate real progress from random fluctuations. It allows you to measure incrementality - the additional lift beyond your baseline that proves your advisor’s efforts are driving revenue [3]. Without this, you’re left guessing whether growth would’ve happened naturally.
Setting up a structured review schedule is key. Here’s how to break it down:
- Weekly: Focus on fast-moving metrics like customer acquisition cost (CAC), new monthly recurring revenue (MRR), and top churn reasons. This provides a quick health check and allows for immediate adjustments [5].
- Monthly: Review unit economics like Net Revenue Retention (NRR), CAC Payback, and the LTV:CAC ratio. These metrics reveal how efficiently your channels are performing [5].
- Quarterly: Dive into cohort retention heatmaps to evaluate long-term product–market fit and sustainability [5].
| Review Frequency | Metrics to Monitor | Purpose |
|---|---|---|
| Weekly | CAC, New MRR, Top Churn Reasons | Quick health check and immediate course corrections [5] |
| Monthly | NRR, CAC Payback, LTV:CAC Ratio | Assessing efficiency and unit economics [5] |
| Quarterly | Cohort Retention Heatmaps | Long-term evaluation of product–market fit [5] |
This cadence helps you uncover trends and patterns that a one-time snapshot would miss. Markets shift, seasonality impacts growth, and customer behaviors change [7]. By monitoring continuously, you can avoid prematurely abandoning strategies that just need more time to show results. Plus, this approach not only validates the impact of advisory work but also helps refine your strategies based on real data.
Tools for Ongoing Measurement
Start simple by using Google Sheets to track core metrics like CAC, MRR, and churn rates [5]. As your data grows, move to automated solutions like Postgres or BigQuery. Eventually, you can adopt tools like dbt to implement version-controlled data models [5].
Organize your data with a three-layer dashboard:
- Top Row: Key performance indicators (KPIs) like NRR and CAC.
- Middle Row: Trends over time to differentiate between meaningful patterns and random noise.
- Bottom Row: Diagnostic tools like cohort heatmaps and churn analysis [5].
This setup turns your dashboard into a decision-making powerhouse, tying in seamlessly with the integrated data strategies discussed in Mistake 6 [5].
When testing new advisory recommendations, establish a baseline by tracking metrics for 8–12 weeks before making changes. Then, test for 6–8 weeks, focusing on one variable at a time to isolate the true impact [3]. This method ensures you’re measuring genuine results, not random fluctuations.
Lastly, keep your data clean. Regularly remove duplicates, irrelevant tracking codes, and inconsistent formats to maintain reliable insights that you can trust.
Conclusion
Measuring the return on investment (ROI) for growth advisory isn't just about crunching numbers - it's about making informed, strategic decisions. The challenges we've explored all stem from one core issue: misjudging the actual value of your investments. Without clear goals, chasing after vanity metrics, or measuring results too early, you're essentially navigating without a compass.
ROI serves as more than just a performance scorecard; it's a strategic tool that helps you decide where to channel your resources effectively. It shows you which strategies deserve more funding and which ones might need to be reconsidered or even dropped [8].
To build a strong foundation for measuring ROI, start with the basics. Define 3–5 key metrics tied directly to revenue, conduct a thorough cost analysis, and set conservative benchmarks before launching new initiatives [3][10]. By doing this and committing to regular reviews, you'll not only see short-term wins but also pave the way for long-term, sustainable growth. It's worth noting that while 81% of communicators now rely on numerical data to validate their strategies, over one-third of B2B marketers still don't track ROI at all [8]. Don't let your business fall into that category.
The companies that excel at ROI measurement strike a balance between immediate results and long-term value. They recognize the delays inherent in complex sales cycles, account for intangible benefits like team alignment, and adapt to shifting market conditions [9][13]. Whether it's avoiding early evaluations or steering clear of vanity metrics, the key is to combine meaningful benchmarks with ongoing, data-driven analysis.
FAQs
::: faq
What’s the best time window to measure growth advisory ROI?
The best timeframe to evaluate the return on investment (ROI) for growth advisory services is generally between 9 to 12 months. Research indicates that contemporary B2B growth strategies tend to deliver measurable outcomes within this period - much quicker compared to the earlier standard of 18 to 24 months. :::
::: faq
Which 3–5 metrics should I track instead of vanity metrics?
Tracking the right growth metrics can make all the difference when assessing your business's performance. Focus on metrics that truly matter: activation rate, time-to-value, expansion readiness, cohort lifetime value (LTV), customer acquisition cost (CAC), and churn rate. These figures go beyond surface-level data, offering actionable insights into how your business is performing and where it can grow. Unlike vanity metrics, which often lack depth or real relevance, these metrics help paint a clearer picture of your growth potential. :::
::: faq
How do I separate advisor impact from market or seasonality effects?
To truly understand an advisor's impact without interference from market trends or seasonal fluctuations, it's essential to zero in on factors directly linked to their actions. Tools like control groups, historical data comparisons, or KPIs tailored to their contributions can be incredibly useful. These methods help separate their influence from external factors, giving you a much clearer picture of their ROI. :::
Go deeper than any blog post.
The full system behind these articles—frameworks, diagnostics, and playbooks delivered to your inbox.
No spam. Unsubscribe anytime.